Introduction
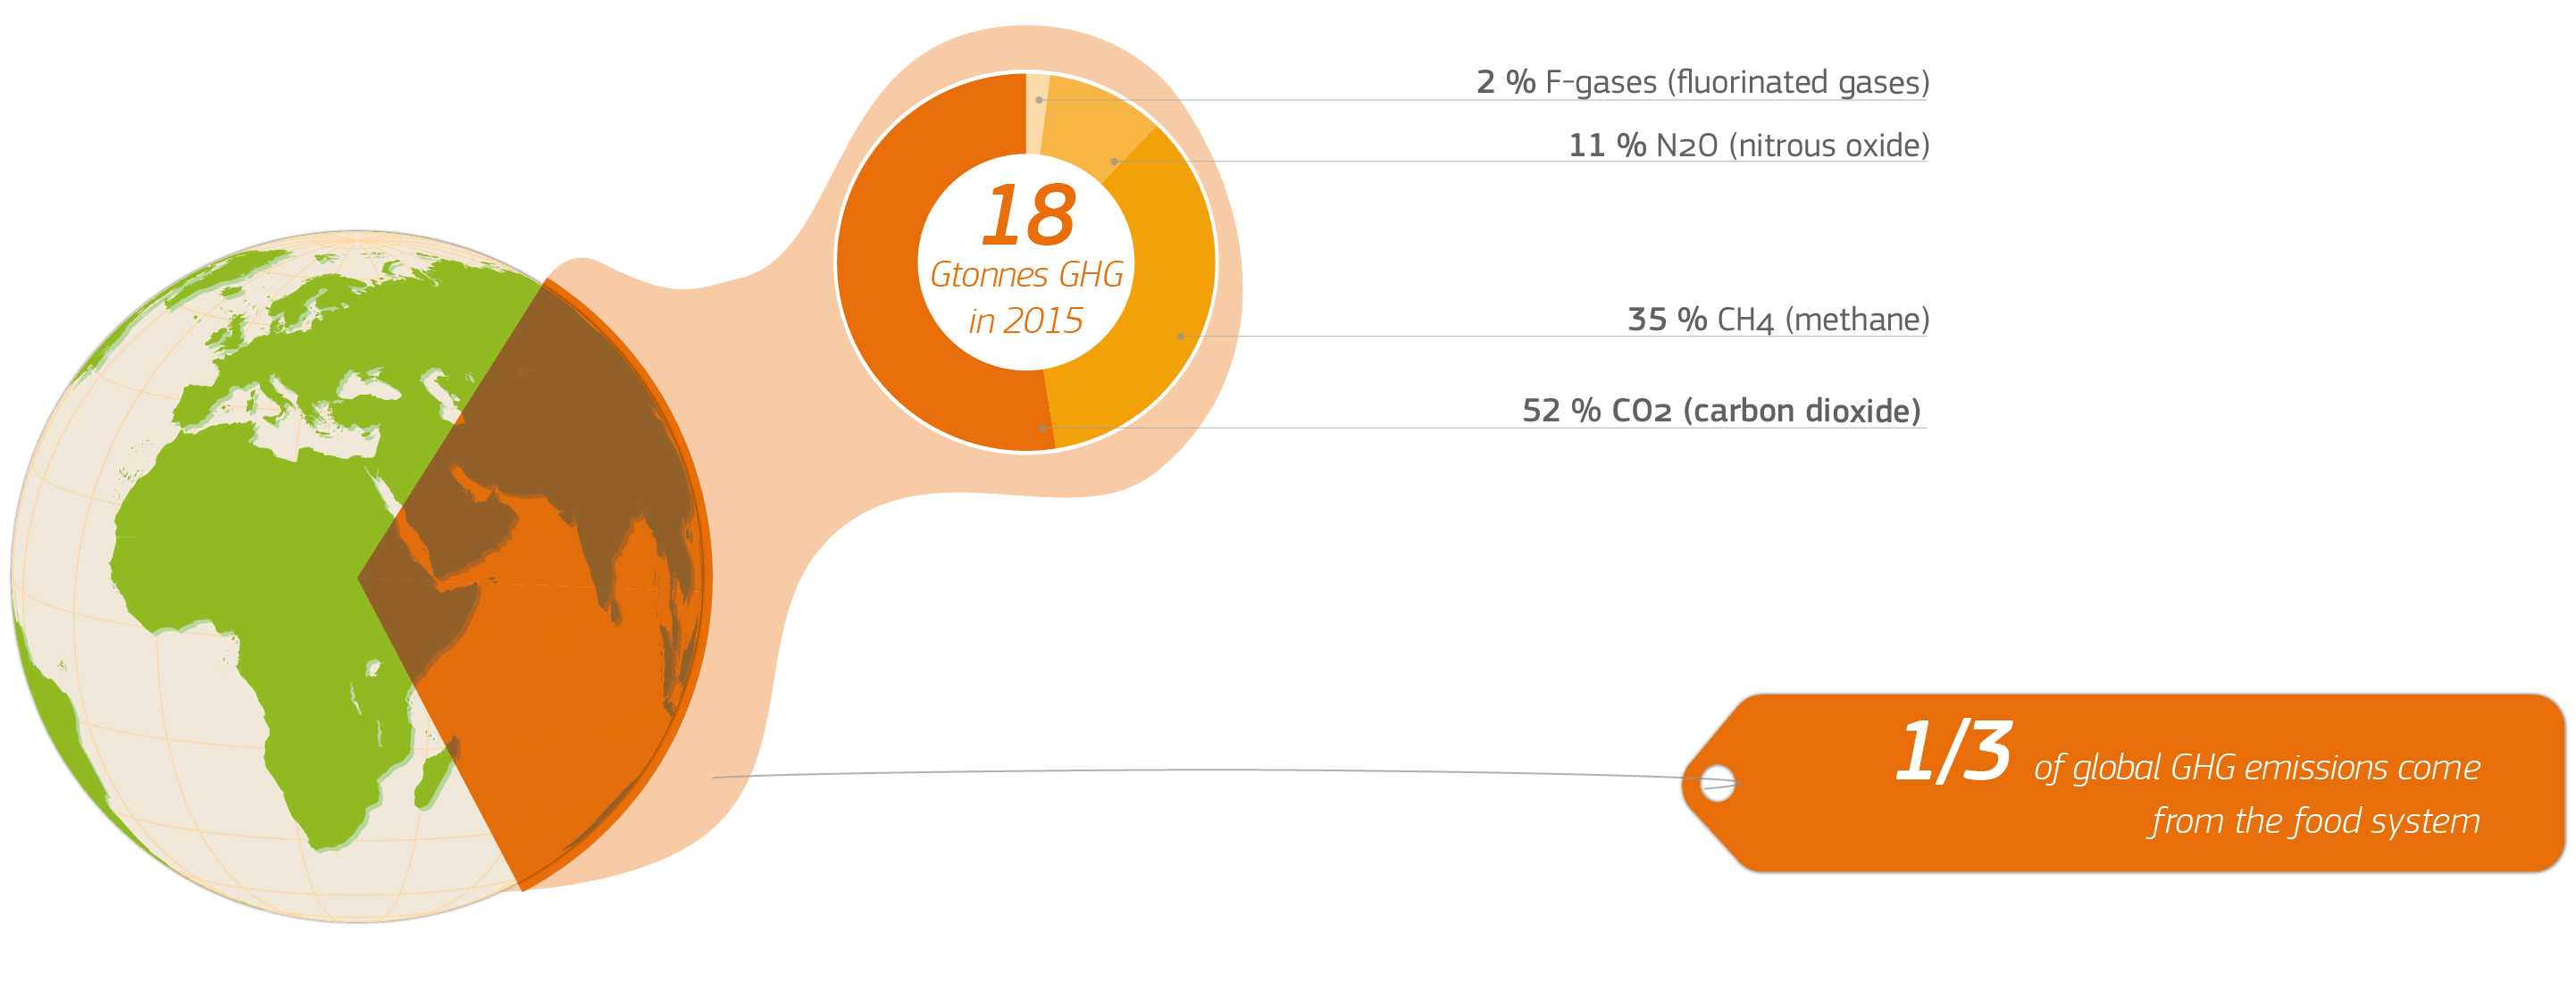
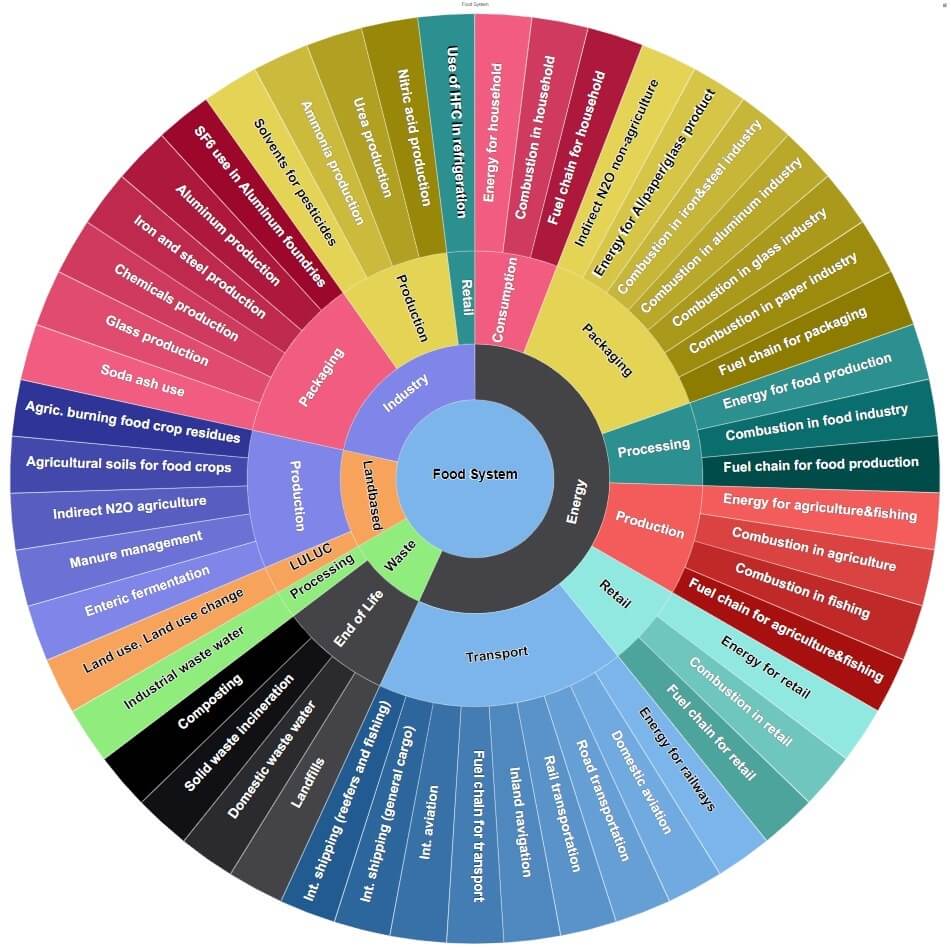
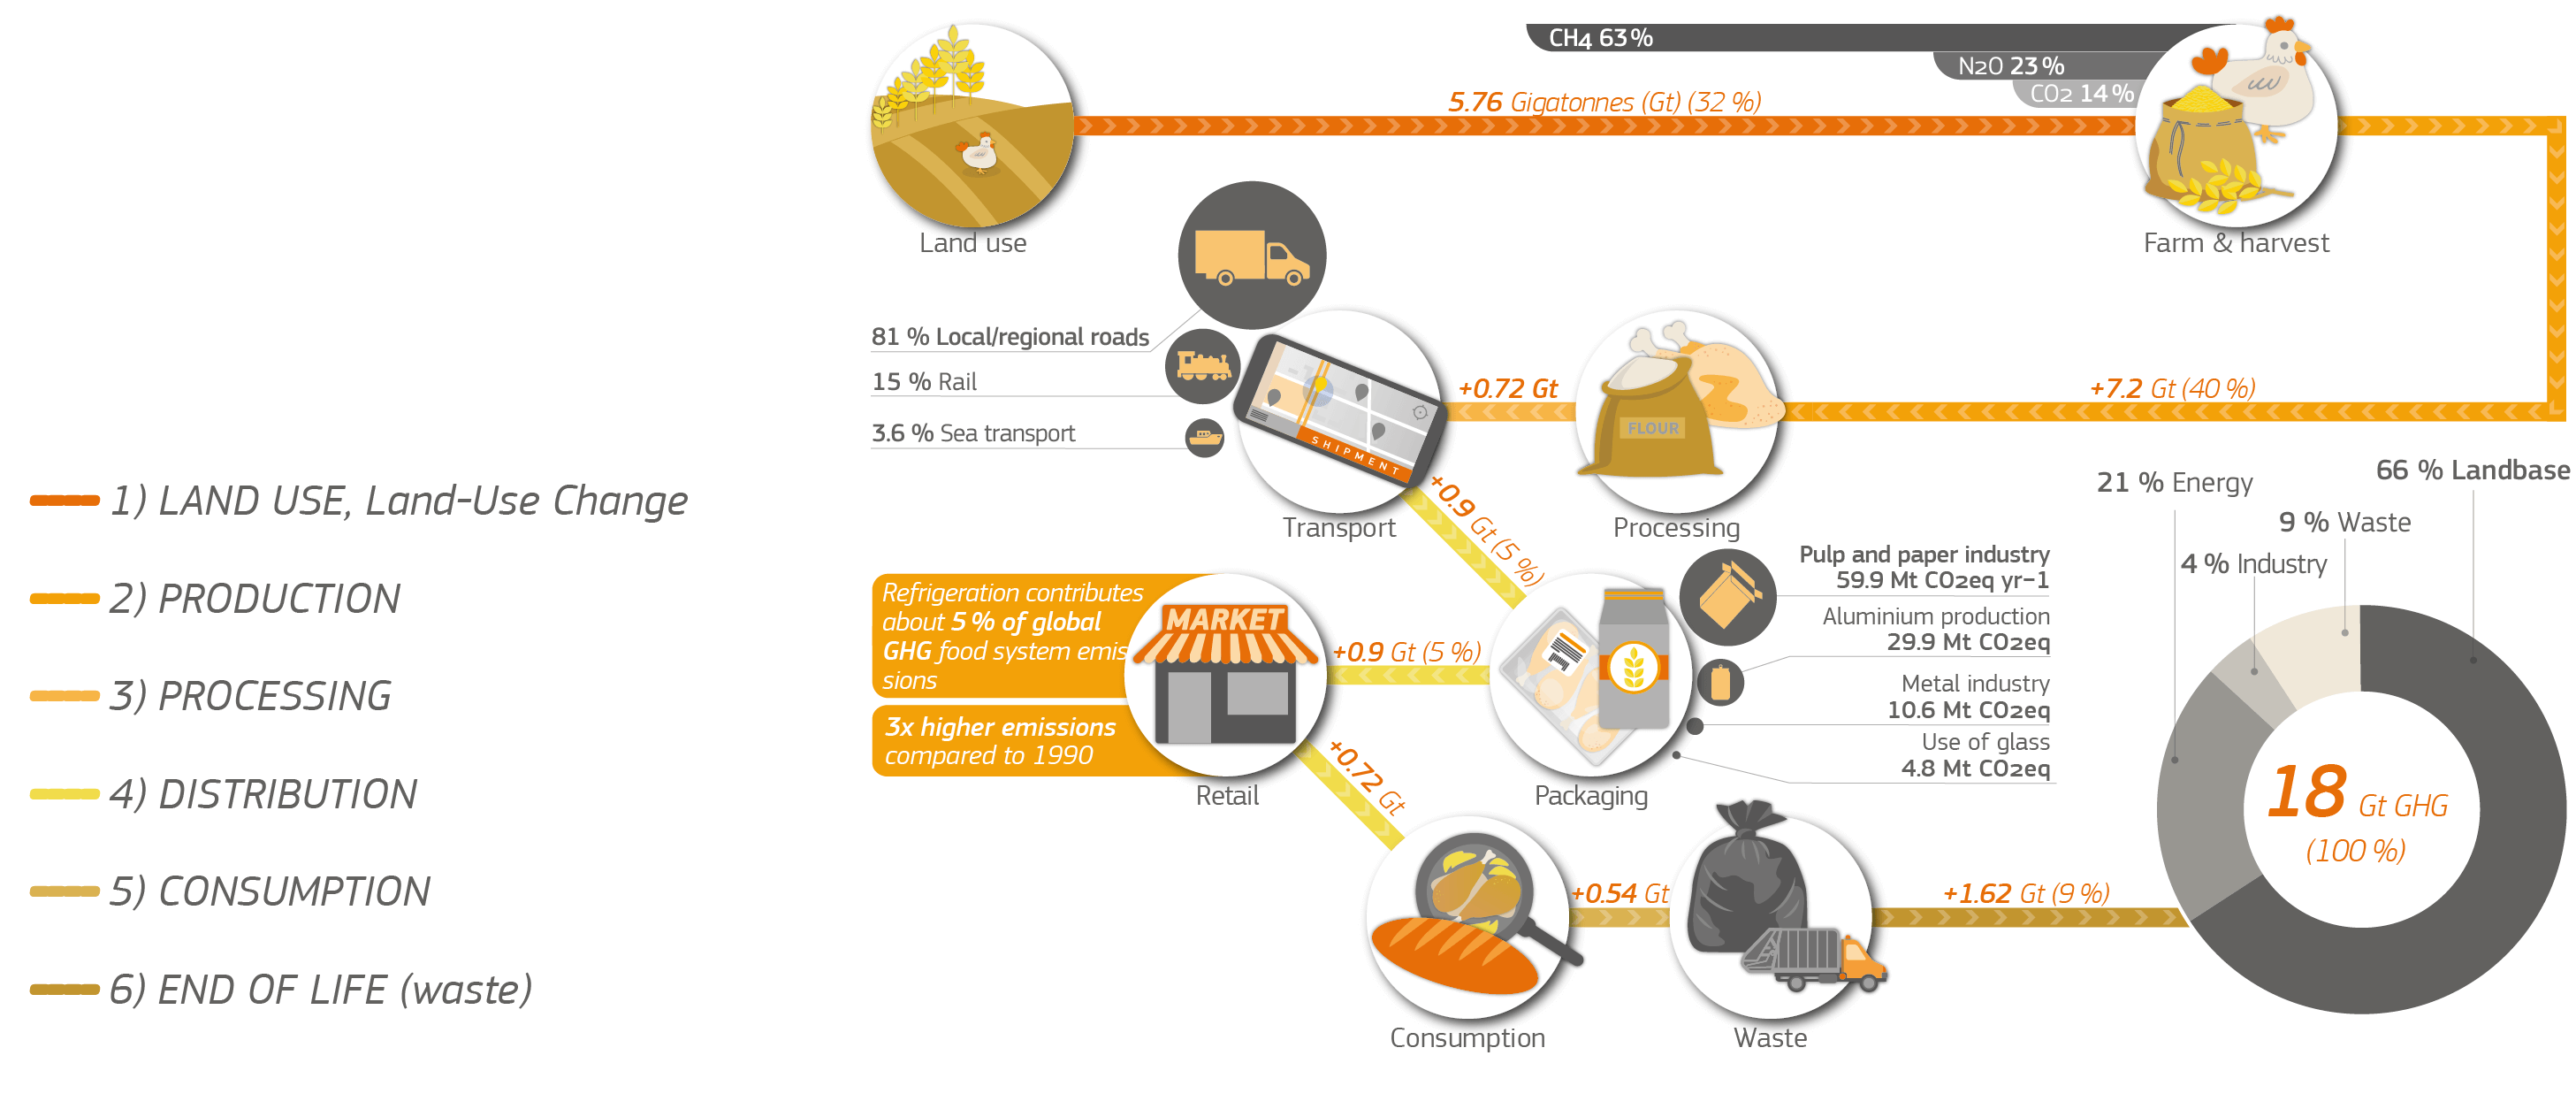
The global food system involves all economic sectors and makes a significant contribution to total anthropogenic greenhouse gas (GHGs) and air pollutant emissions. Understanding the various components is a necessary precursor to the design and implementation of actionable and efficient mitigation measures for the system. Food systems' GHG emissions are far more than emissions from the land-based sector (agriculture and food-relevant emissions from land use and land use change). Food needs to be farmed, harvested or caught, transported, processed, packaged, distributed and cooked, and the residuals disposed of. The energy required for all those processes needs to be produced and made available at the right time and location (see Fig.1).
EDGAR-FOOD has been developed to aid the understanding of the activities underlying the energy demand and use, agriculture and land use change emissions associated with the production, distribution, consumption and disposal of food through the various stages and sectors of the composite global food system. These data were complemented with data from the FAOSTAT database on GHG emissions from land use related to agriculture (FAO, 2020). EDGAR-FOOD represents the first database consistently covering each stage of the food chain for all countries with yearly frequency for the period 1990-2015. Details regarding the methodology applied are available in Crippa et al. (2021).
Main Findings
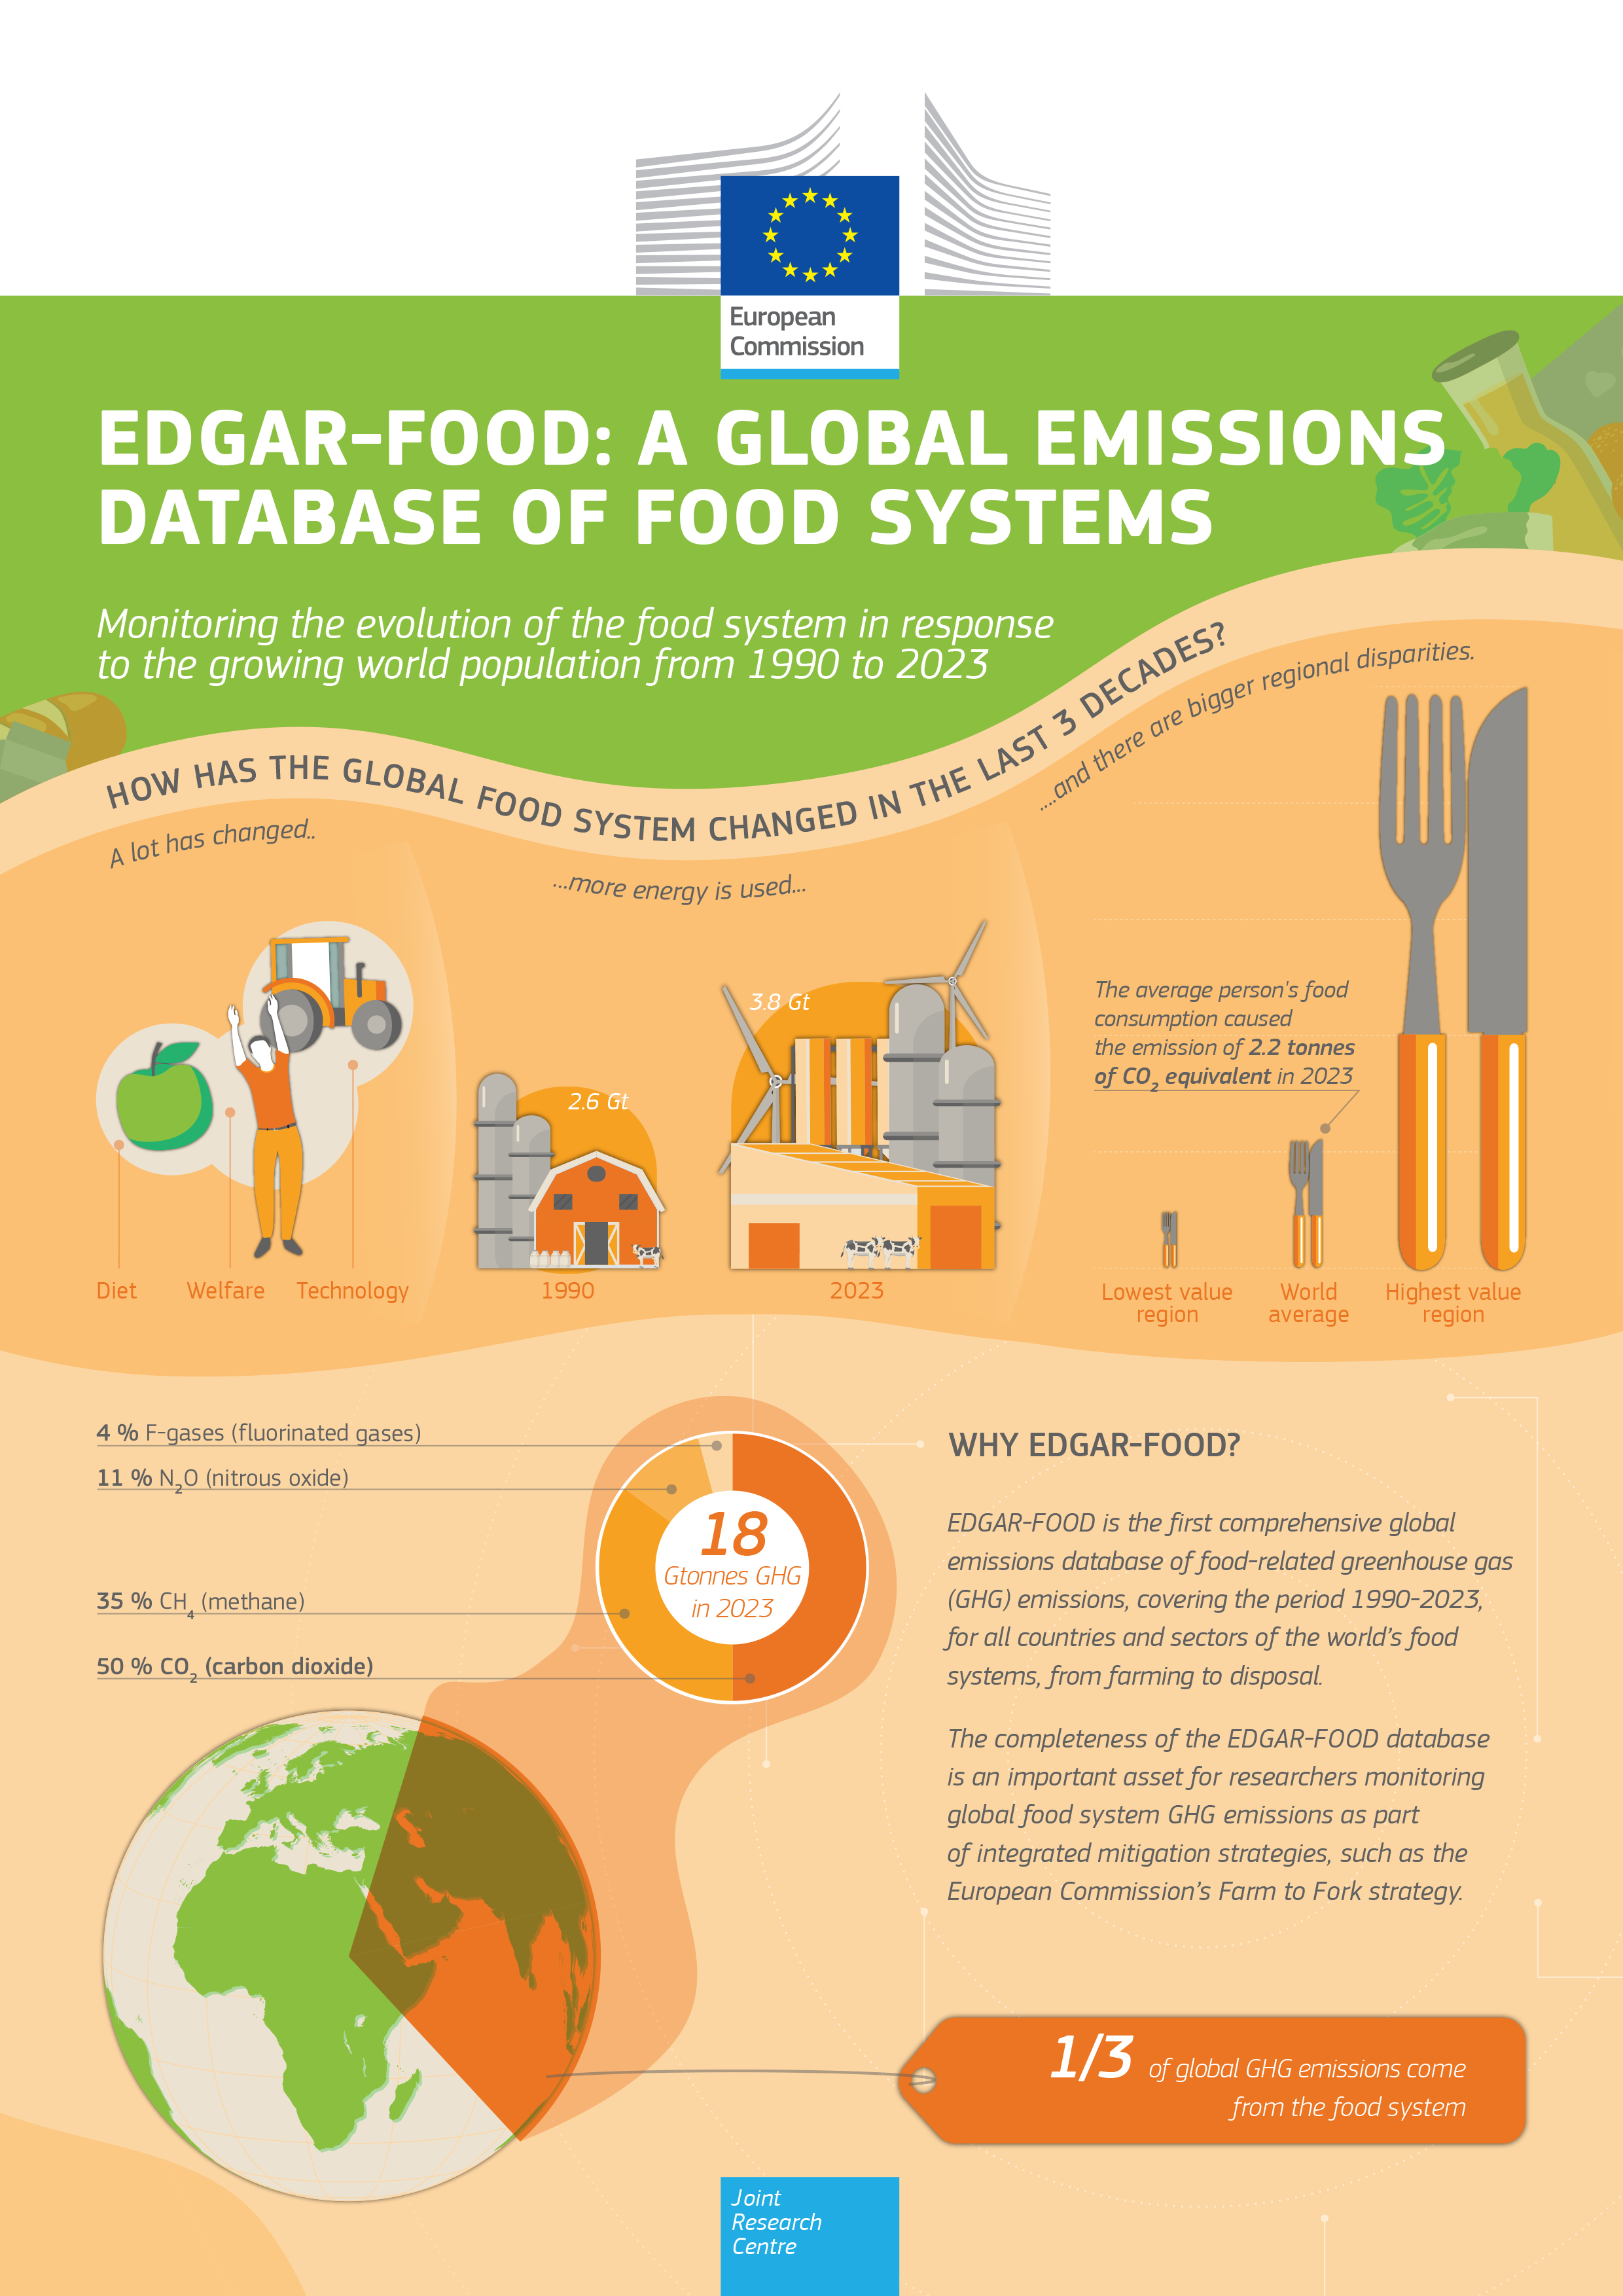
EDGAR-FOOD provides a picture of how an evolving world food system has responded to the evolution of world population in the last 25 years, together with changes in dietary habits and food related technology. At the global level, decoupling between population growth and food-related emissions is visible with emissions growing at a lower rate compared to population growth. Nevertheless, the regional view is more diverse, with some areas rapidly increasing emissions either due to domestic demand for food or for export.
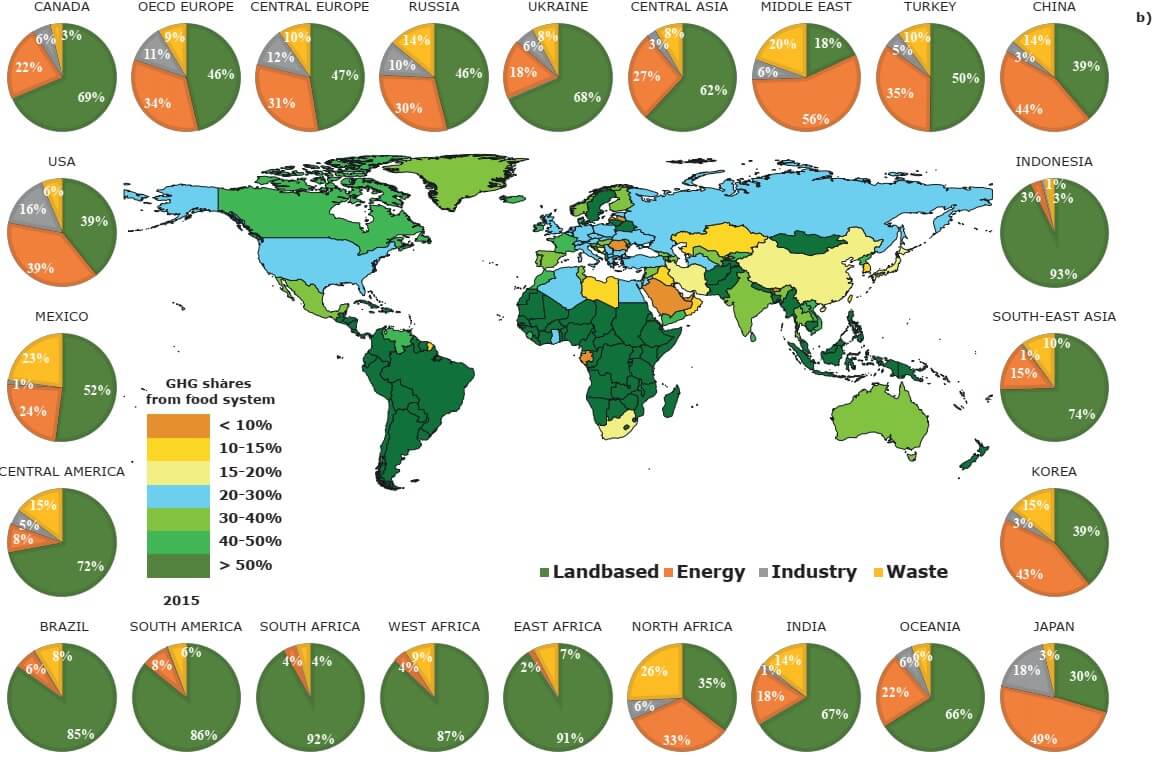
Unlike overall GHGs emissions, the food production sector is not overwhelmingly dominated by CO2 emissions from fossil fuels; land-based emissions are particularly relevant. Nevertheless, in line with the ongoing socio-economic development trends, food emissions are being increasingly determined by energy use, industrial activities and waste management.
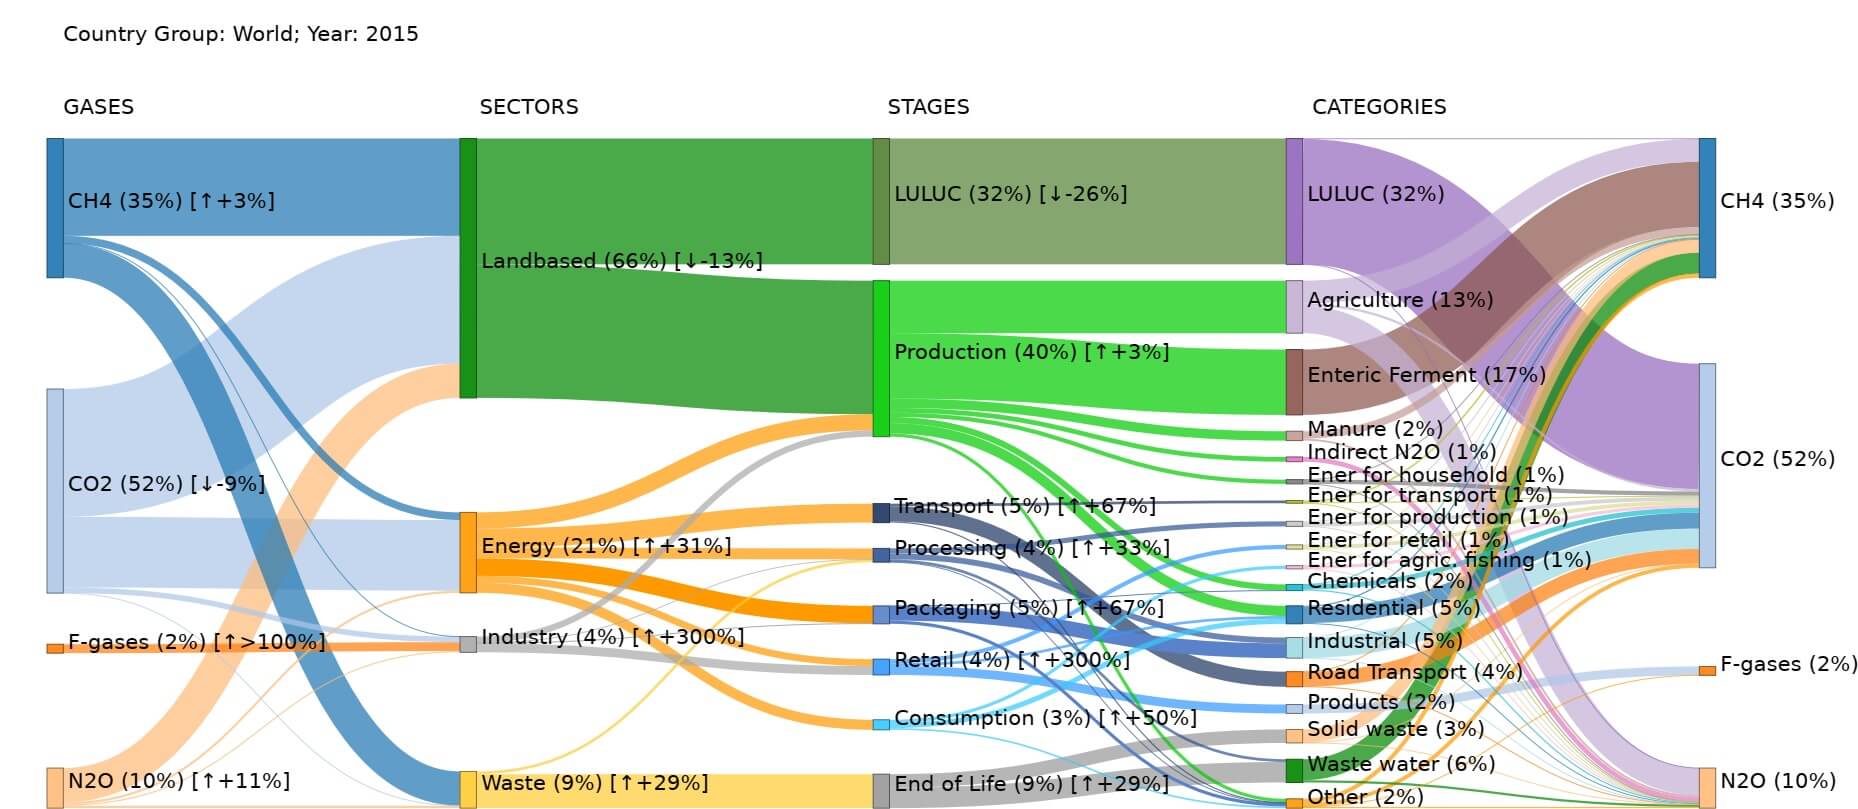
From the mitigation point of view, such a trend suggests that the food sector will need specific sectorial energy efficiency and decarbonisation policies. On the other hand, the continuing predominant role of land-based emissions, within and outside the farm gate, shows that food production per se will continue to be a major source of emissions in need of dedicated mitigation policies. Moreover, EDGAR-FOOD is crucial to the anticipation of future changes in the overall food system in order to design efficient mitigation strategies that avoid creating additional emissions in non-targeted sectors.
The completeness of the EDGAR-FOOD database is an important asset for effectively monitoring global food system GHG and air pollutant emissions in line with the strategies willing to work on an integrated view of the food system, such as the new European Commission's Farm to Fork strategy.
Data Downloads
How to cite
Crippa, M., Solazzo, E., Guizzardi, D. et al. Food systems are responsible for a third of global anthropogenic GHG emissions. Nat Food (2021). doi:10.1038/s43016-021-00225-9.
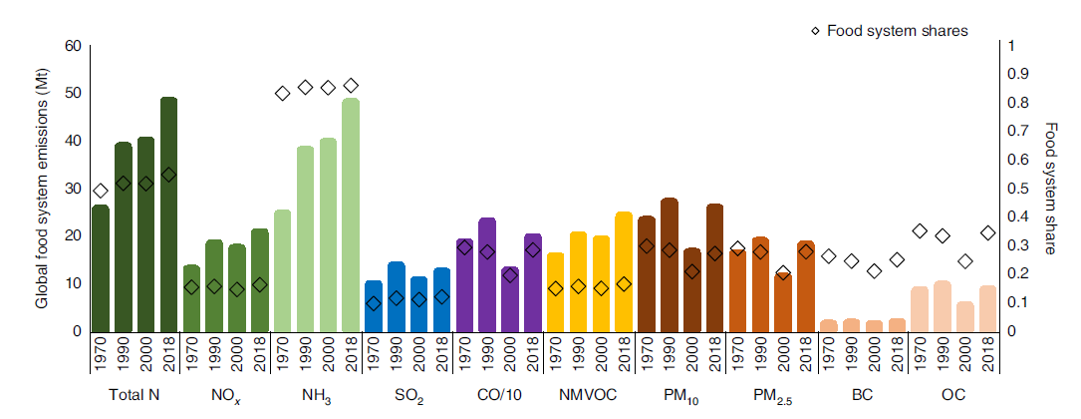
M. Crippa , E. Solazzo, D. Guizzardi, R. Van Dingenen & A. Leip: Air pollutant emissions from global food systems are responsible for environmental impacts, crop losses and mortality, Nature Food, doi:10.1038/s43016-022-00615-7, 2022.
What they say about us
- Carbon Brief: https://www.carbonbrief.org/food-systems-responsible-for-one-third-of-human-caused-emissions
- JRC Science Update: https://ec.europa.eu/jrc/en/science-update/edgar-food
- Forbes: https://www.forbes.com/sites/davidrvetter/2021/03/10/how-much-does-our-food-contribute-to-global-warming-new-research-reveals-all/?sh=41b7f51327d7
- Quota: https://quota.media/food-systems-greenhouse-gas-emissions-higher-than-past-estimates/
- Alan Matthews: https://capreform.eu/measuring-food-system-emissions/
- Table debates: https://tabledebates.org/research-library/food-systems-cause-third-global-ghg-emissions
Sources and references
Crippa, M., Solazzo, E., Guizzardi, D. et al. Food systems are responsible for a third of global anthropogenic GHG emissions. Nat Food (2021). doi:10.1038/s43016-021-00225-9
Crippa, M., Solazzo, E., Guizzardi, D., Tubiello, F. N. & Leip, A. Climate goals require food systems emission inventories. Nature Food, (2022). doi:10.1038/s43016-021-00450-2
Dataset (based on EDGARv6.0): Crippa, Monica; Guizzardi, Diego; Solazzo, Efisio; Leip, Adrian; Tubiello, Francesco N. (2021): EDGAR-FOOD_v6. figshare. doi:10.6084/m9.figshare.17067449
Dataset (based on EDGARv5.0): Crippa, Monica; Guizzardi, Diego; Solazzo, Efisio; Ferrario-Monforti, Fabio; Tubiello, Francesco N; Leip, Adrian (2021): EDGAR-FOOD emission data. figshare. doi:10.6084/m9.figshare.13476666
FAO. FAOSTAT Agri-Environmental Indicators, Emissions shares, http://www.fao.org/faostat/en/#data/EM. (2020).
Contacts
For more information or data: JRC-EDGAR@ec.europa.eu