2019 report
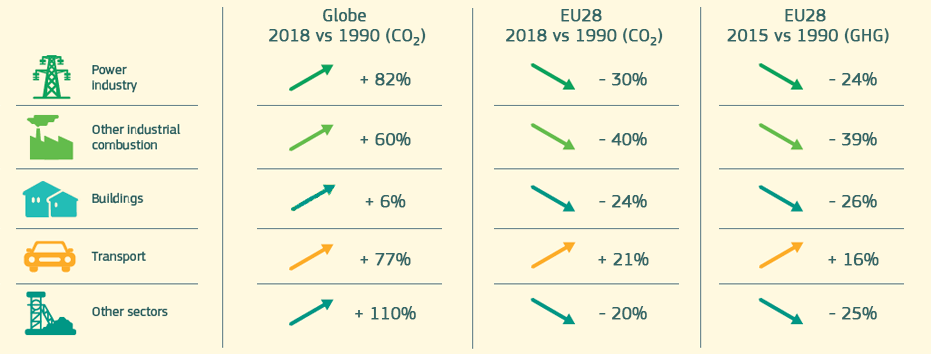
The global GHG emissions trend has increased since the beginning of the 21st century in comparison to the three previous decades, mainly due to the increase in CO2 emissions from China and the other emerging economies. As a result, the atmospheric concentrations of greenhouse gases substantially increased enhancing the natural greenhouse effect, which may negatively affect the life on the Earth. These issues are internationally addressed in the framework of UNFCCC; countries are developing national emissions inventories and propose/implement actions to mitigate GHG emissions. CO2 emissions, which are the main responsible for global warming are still increasing at world level despite climate change mitigation agreements. However, CO2 emissions within the EU28 have decreased in the last two decades. Human related activities largely influence the total CO2 emissions – particularly, power generation and road transport but also emissions from combustion in the residential and commercial sectors play a key role. Despite decreasing trends for total EU28 CO2 emissions, CO2 emissions per capita within the EU28 are still higher than the world average value.
Global CO2 emissions from fossil fuels combustion and processes further increased by 1.9% in 2018 compared to the previous year reaching a total of 37.9 Gt CO2. In 2018, China, the United States, India, the EU28, Russia and Japan - the world’s largest CO2 emitters - together accounted for 51% of the population, 65% of global Gross Domestic Product World Bank, 80% of total global fossil fuel consumption and emitted 67.5% of total global fossil CO2. Emissions from these five countries and the EU28 show different changes in 2018 compared to 2017: the largest increase in the emissions between 2017 and 2018 is found for India (+7.2%), followed by Russia (+3.5%), the United States (+2.9%) and China (+1.5%). By comparison, both the EU28 (-1.9%) and Japan (-1.7%) reduced their fossil CO2 emissions. Compared to 1990, EU28 fossil CO2 emissions were 21.6% lower in 2018 at 3.46 Gt CO2, representing 9.1% of the global share and equivalent to 6.8 t CO2/cap/yr in per-capita terms which is above the global per capita average (4.97 t CO2/cap/yr).
Global GHG emissions are dominated by fossil CO2 and increased steadily over the entire period 1990-2015 by about 50% from 32.8 to 49.1 Gt CO2eq/yr. Per capita GHG emissions decreased in the 1980s and 1990s to a minimum of 5.7 t CO2eq/cap/yr but have then increased by 13.4% from 2000 to 2015 to reach 6.7 t CO2eq/cap/yr.
Crippa, M., Oreggioni, G., Guizzardi, D., Muntean, M., Schaaf, E., Lo Vullo, E., Solazzo, E., Monforti-Ferrario, F., Olivier, J.G.J., Vignati, E., Fossil CO2 and GHG emissions of all world countries - 2019 Report, EUR 29849 EN, Publications Office of the European Union, Luxembourg, 2019, ISBN 978-92-76-11100-9, doi:10.2760/687800, JRC117610.
The data are presented in the table below for key years, to allow easy comparison of different countries.
"Country names" are consistent with the Interinstitutional Style Guide of the European Commission, the “Short name” definition listed in the "List of countries, territories and currencies" table has been used (as of 16/07/2019)
EDGAR data are expressed in metric units.
BP 2015-2018 data of the BP Statistical Review of World Energy, https://www.bp.com/en/global/corporate/energy-economics/statistical-review-of-world-energy.html, June 2019.
IEA energy balance statistics for 1970-2015 (2017) (http://www.iea.org/).
Olivier, J.G.J. and J.A.H.W. Peters (2019), Trend in Global CO2 and GHG Emissions - 2019 Report, PBL Report, 2019.
IFA 2013-2016 urea consumption and production statistics, https://www.fertilizer.org, June 2019.
IMF/WEO data of annual GDP growth for missing data in the WB dataset for recent years. World Economic Outlook Update April 2019. International Monetary Fund, 2019.
UNDP population statistics (2019), World Population Prospects (WPP), The 2019 Revision Report United Nations, Department of Economic and Social Affairs, Population Division, 2019.
USGS: 2010-2018 data of cement, lime, ammonia and ferroalloys of the USGS Commodity Statistics (June 2019), (https://minerals.usgs.gov/minerals/pubs/commodity/), 2019.
WB data of GDP (expressed in 1000 US dollar, and adjusted to the Purchasing Power Parity of 2011) for 1990-2018, World Bank, July 2019.
World Steel Association, worldsteel, Steel Statistical Yearbook 2018 (pdf), November 2018.
For more information or data: JRC-EDGAR@ec.europa.eu