2021 report
Since the beginning of 21st century and until 2019, global GHG emissions had followed an increasing trend mainly due to the increase in CO2 emissions from China and the other emerging economies. As a result, the atmospheric concentrations of greenhouse gases substantially increased enhancing the natural greenhouse effect, which may negatively affect the life on the Earth. Regardless the slowing down of global emissions in 2020 caused by the global COVID-19 pandemic, climate change remains an issue.
That is internationally addressed in the framework of UNFCCC; countries are developing national emissions inventories and propose/implement actions to mitigate GHG emissions. CO2 emissions, which are the main responsible for global warming are still increasing at world level despite climate change mitigation agreements.
EDGAR provides an independent estimate of greenhouse gases for each world country, based on a robust and consistent methodology stemming from the latest IPCC guidelines and most recent activity data. Following the latest update released in October 2021, emission data are now available for fossil CO2 for each country for the time period 1970-2020 while national emissions for other GHGs are available for 1970-2018.
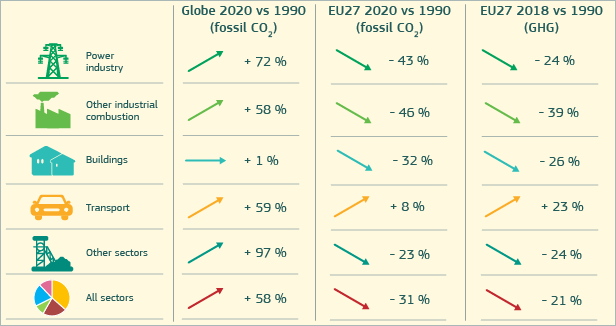
Global CO2 emissions from fossil fuels combustion and processes decreased by 5.1% in 2020 ( they had increased by 0.9% in 2019), at 36.0 Gt CO2, just below the 36.2 Gt CO2 emission level registered in 2013.
In 2020, China, the United States, the EU27, India, Russia and Japan remained the world’s largest CO2 emitters - together they accounting for 49.5% of the population, 61.8% of global Gross Domestic Product, 65.2% of total global fossil fuel consumption and 66.7% of total global fossil CO2
Among these top six world emitters, only China has shown an increase in emissions in 2020 (+1.5%) while all others have decreased their emissions by different amounts: EU27 by 10.6%, United States by 9.9%, Japan by 6.8%, India by 5.9% and Russiaby 5.8%.
Regardless the important decrease of GDP observed in the majority of world countries global fossil CO2 emissions per unit of GDP continued their decreasing trend (-5.4% in 2020 and -35% between 2020 and 1990) reaching the average value of 0.282 tCO2/kUSD/yr. Per capita emissions also decreased in 2020, by 6.5% to a value of 4.62 tCO2/capita/yr, leading to a 8.2% increase from 1990.
EU27 total fossil CO2 emissions had already decreased over the past two decades and emissions in 2019 were 23.2% lower than in 1990 and 20.7% lower than in 2005(14). The COVID-19 pandemic brought the EU27 CO2 emissions to decline by 31.3% [31.5%] in comparison with 1990 and by 29.1% [29.3%] in comparison with 2005.
The EU27 share of the global total emissions decreased from 8.5% to 7.8% between 2015 and 2019 to fall to 7.3% in 2020. In 2020, the EU27 emitted 2.6 Gt CO2, corresponding to 5.9 t CO2 per person.
Crippa, M., Guizzardi, D., Solazzo, E., Muntean, M., Schaaf, E., Monforti-Ferrario, F., Banja, M., Olivier, J.G.J., Grassi, G., Rossi, S., Vignati, E.,GHG emissions of all world countries - 2021 Report, EUR 30831 EN, Publications Office of the European Union, Luxembourg, 2021, ISBN 978-92-76-41547-3, doi:10.2760/173513, JRC126363
The data are presented in the table below for key years, to allow easy comparison of different countries.
"Country names" are consistent with the Interinstitutional Style Guide of the European Commission, the "Short name" definition listed in the "List of countries, territories and currencies" table has been used (as of 20/07/2021)
EDGAR data are expressed in metric units.
| Country | 1990 | 1995 | 2000 | 2005 | 2010 | 2015 | 2017 | 2018 |
|---|---|---|---|---|---|---|---|---|
| unit | ton CO2eq/cap | ton CO2eq/cap | ton CO2eq/cap | ton CO2eq/cap | ton CO2eq/cap | ton CO2eq/cap | ton CO2eq/cap | ton CO2eq/cap |
| EU27 | 11.79 | 10.89 | 10.63 | 10.63 | 9.76 | 8.94 | 9.01 | 8.86 |
| GLOBAL TOTAL | 6.13 | 5.92 | 5.93 | 6.38 | 6.67 | 6.70 | 6.66 | 6.71 |
| Afghanistan | 1.06 | 0.75 | 0.74 | 0.67 | 0.96 | 0.84 | 0.83 | 0.81 |
| Albania | 3.40 | 2.02 | 2.24 | 2.54 | 2.69 | 2.93 | 3.06 | 3.06 |
| Algeria | 5.23 | 5.48 | 5.37 | 5.34 | 5.45 | 6.20 | 6.10 | 6.25 |
| Angola | 2.57 | 3.47 | 3.84 | 3.32 | 3.04 | 2.94 | 2.56 | 2.43 |
| Anguilla | 1.01 | 1.97 | 1.69 | 1.35 | 2.03 | 2.21 | 2.24 | 2.16 |
| Antigua and Barbuda | 7.32 | 7.22 | 6.09 | 6.52 | 6.89 | 8.09 | 6.27 | 6.05 |
| Argentina | 8.05 | 8.13 | 8.43 | 9.15 | 8.97 | 9.25 | 9.06 | 8.89 |
| Armenia | 6.81 | 1.84 | 1.93 | 2.45 | 2.45 | 2.77 | 2.91 | 2.96 |
| Aruba | 8.89 | 9.91 | 10.31 | 12.14 | 10.48 | 11.69 | 8.99 | 8.70 |
| Australia | 26.27 | 25.86 | 28.03 | 28.16 | 26.47 | 24.38 | 23.96 | 23.49 |
| Austria | 10.56 | 10.47 | 10.60 | 11.90 | 10.84 | 9.79 | 10.06 | 9.76 |
| Azerbaijan | 9.49 | 5.59 | 4.99 | 5.33 | 5.15 | 5.82 | 5.66 | 5.66 |
| Bahamas | 11.71 | 10.90 | 11.65 | 8.41 | 8.37 | 8.26 | 6.75 | 6.52 |
| Bahrain | 56.37 | 58.16 | 54.20 | 45.56 | 38.71 | 42.50 | 39.10 | 37.81 |
| Bangladesh | 1.22 | 1.15 | 1.12 | 1.18 | 1.34 | 1.46 | 1.51 | 1.54 |
| Barbados | 6.01 | 5.44 | 6.40 | 6.43 | 6.51 | 6.77 | 5.58 | 5.44 |
| Belarus | 13.71 | 8.40 | 7.87 | 8.54 | 9.74 | 10.66 | 10.73 | 11.01 |
| Belgium | 14.38 | 14.97 | 15.19 | 14.15 | 13.37 | 11.81 | 11.37 | 11.35 |
| Belize | 3.31 | 2.88 | 3.00 | 2.78 | 3.01 | 3.11 | 2.76 | 2.69 |
| Benin | 0.78 | 0.72 | 0.90 | 1.04 | 1.29 | 1.30 | 1.43 | 1.50 |
| Bermuda | 12.46 | 9.36 | 9.14 | 10.11 | 12.36 | 11.08 | 11.28 | 11.04 |
| Bhutan | 1.99 | 2.56 | 2.47 | 2.52 | 2.77 | 2.93 | 2.79 | 2.93 |
| Bolivia | 4.18 | 3.84 | 3.64 | 3.81 | 4.39 | 4.88 | 5.11 | 5.16 |
| Bosnia and Herzegovina | 7.06 | 1.61 | 5.15 | 5.98 | 7.41 | 7.56 | 8.62 | 8.75 |
| Botswana | 6.33 | 5.73 | 5.78 | 5.16 | 4.75 | 5.49 | 5.18 | 5.53 |
| Brazil | 4.53 | 5.02 | 5.25 | 5.63 | 5.88 | 6.26 | 6.11 | 5.97 |
| British Virgin Islands | 3.45 | 3.03 | 4.79 | 5.15 | 5.94 | 6.53 | 6.17 | 5.91 |
| Brunei | 28.73 | 31.04 | 30.91 | 28.84 | 33.74 | 28.33 | 29.83 | 29.49 |
| Bulgaria | 11.63 | 9.07 | 7.70 | 8.50 | 8.28 | 8.71 | 8.86 | 8.48 |
| Burkina Faso | 1.17 | 1.19 | 1.16 | 1.44 | 1.47 | 1.50 | 1.49 | 1.48 |
| Burundi | 0.52 | 0.50 | 0.44 | 0.45 | 0.50 | 0.51 | 0.55 | 0.55 |
| Cabo Verde | 0.65 | 0.78 | 1.27 | 1.95 | 2.15 | 1.97 | 2.00 | 2.06 |
| Cambodia | 2.03 | 2.02 | 1.84 | 2.00 | 2.27 | 2.33 | 2.56 | 2.55 |
| Cameroon | 2.41 | 1.95 | 1.97 | 1.73 | 1.54 | 1.68 | 1.59 | 1.60 |
| Canada | 21.30 | 21.94 | 23.32 | 22.87 | 20.99 | 21.23 | 20.56 | 20.62 |
| Cayman Islands | 11.93 | 10.66 | 10.31 | 9.05 | 9.77 | 11.02 | 9.05 | 8.70 |
| Central African Republic | 1.62 | 1.72 | 1.82 | 1.86 | 2.02 | 2.22 | 2.30 | 2.29 |
| Chad | 1.68 | 2.80 | 2.95 | 3.36 | 3.65 | 4.19 | 4.39 | 4.42 |
| Chile | 4.30 | 4.83 | 5.51 | 5.67 | 6.10 | 6.59 | 6.89 | 6.90 |
| China | 3.34 | 4.05 | 4.16 | 6.33 | 8.48 | 9.45 | 9.50 | 9.71 |
| Colombia | 3.83 | 3.91 | 3.70 | 3.59 | 3.72 | 3.84 | 3.82 | 3.93 |
| Comoros | 0.76 | 0.72 | 0.79 | 0.82 | 0.83 | 0.81 | 0.93 | 0.94 |
| Congo | 4.06 | 3.97 | 5.94 | 4.84 | 4.62 | 3.75 | 3.80 | 3.89 |
| Cook Islands | 2.69 | 2.85 | 3.42 | 3.99 | 3.98 | 5.56 | 3.74 | 3.82 |
| Costa Rica | 3.08 | 3.14 | 2.79 | 2.79 | 2.98 | 2.97 | 3.12 | 3.11 |
| Côte d’Ivoire | 0.84 | 0.86 | 1.04 | 1.02 | 1.02 | 1.18 | 1.20 | 1.18 |
| Croatia | 7.20 | 5.18 | 5.91 | 7.05 | 6.73 | 6.23 | 6.46 | 6.17 |
| Cuba | 5.89 | 4.06 | 4.43 | 3.97 | 4.46 | 4.18 | 4.09 | 4.02 |
| Curaçao | 19.32 | 19.83 | 44.38 | 48.13 | 30.97 | 31.04 | 24.51 | 21.05 |
| Cyprus | 6.90 | 7.65 | 8.50 | 8.76 | 8.44 | 7.10 | 7.49 | 7.23 |
| Czechia | 18.76 | 15.02 | 14.82 | 14.55 | 13.58 | 12.38 | 12.54 | 12.37 |
| Democratic Republic of the Congo | 0.67 | 0.55 | 0.50 | 0.47 | 0.45 | 0.58 | 0.58 | 0.57 |
| Denmark | 13.69 | 15.02 | 13.30 | 12.47 | 11.58 | 8.69 | 8.59 | 8.54 |
| Djibouti | 3.41 | 3.63 | 2.65 | 2.46 | 2.34 | 2.18 | 2.31 | 2.32 |
| Dominica | 1.54 | 2.31 | 2.51 | 2.81 | 3.09 | 3.44 | 3.45 | 3.37 |
| Dominican Republic | 2.41 | 2.77 | 3.33 | 3.25 | 3.48 | 3.64 | 3.63 | 3.79 |
| Ecuador | 3.58 | 3.97 | 3.46 | 3.91 | 4.46 | 4.33 | 4.02 | 4.05 |
| Egypt | 2.51 | 2.55 | 2.81 | 3.47 | 3.63 | 3.55 | 3.68 | 4.01 |
| El Salvador | 1.42 | 1.79 | 1.83 | 2.07 | 1.94 | 1.96 | 1.85 | 1.88 |
| Equatorial Guinea | 0.51 | 10.54 | 17.68 | 22.30 | 19.18 | 13.04 | 10.86 | 10.50 |
| Eritrea | 1.44 | 1.44 | 1.58 | 1.36 | 1.24 | 1.25 | 1.23 | 1.23 |
| Estonia | 26.16 | 15.28 | 14.41 | 17.01 | 19.42 | 18.49 | 19.13 | 19.22 |
| Eswatini | 3.25 | 3.21 | 4.20 | 4.24 | 3.80 | 2.40 | 2.40 | 2.44 |
| Ethiopia | 1.31 | 1.11 | 1.09 | 1.17 | 1.36 | 1.39 | 1.43 | 1.42 |
| Falkland Islands | 85.75 | 74.03 | 57.80 | 59.10 | 63.06 | 64.73 | 61.57 | 60.97 |
| Faroes | 0.91 | 0.94 | 0.92 | 0.91 | 0.90 | 0.92 | 0.90 | 0.90 |
| Fiji | 2.88 | 3.08 | 3.31 | 3.59 | 2.65 | 3.65 | 3.58 | 3.65 |
| Finland | 16.62 | 16.47 | 16.17 | 16.47 | 17.60 | 13.94 | 13.26 | 13.50 |
| France and Monaco | 9.66 | 9.40 | 9.14 | 8.89 | 8.12 | 7.10 | 7.11 | 6.90 |
| French Guiana | 6.40 | 7.08 | 3.48 | 3.18 | 3.28 | 2.70 | 2.41 | 2.30 |
| French Polynesia | 4.64 | 3.61 | 3.29 | 3.92 | 3.64 | 4.02 | 3.70 | 3.76 |
| Gabon | 18.95 | 18.99 | 19.50 | 16.57 | 11.55 | 10.10 | 9.01 | 8.66 |
| Georgia | 7.75 | 2.80 | 2.39 | 2.49 | 2.81 | 4.07 | 4.22 | 4.20 |
| Germany | 15.54 | 13.73 | 12.83 | 12.07 | 11.66 | 11.14 | 10.94 | 10.62 |
| Ghana | 0.72 | 0.74 | 0.83 | 0.83 | 0.95 | 1.18 | 1.21 | 1.27 |
| Gibraltar | 5.42 | 9.93 | 11.55 | 13.30 | 14.97 | 17.98 | 21.19 | 23.35 |
| Greece | 9.87 | 9.90 | 10.70 | 11.32 | 9.87 | 8.30 | 8.37 | 8.24 |
| Greenland | 1.14 | 1.15 | 1.14 | 12.15 | 12.77 | 10.57 | 10.29 | 10.30 |
| Grenada | 1.76 | 1.96 | 2.18 | 2.40 | 2.84 | 3.25 | 2.68 | 2.61 |
| Guadeloupe | 4.62 | 4.86 | 4.72 | 4.74 | 5.16 | 5.37 | 4.98 | 4.87 |
| Guatemala | 1.44 | 1.70 | 1.90 | 1.94 | 1.96 | 2.25 | 2.26 | 2.35 |
| Guinea | 1.16 | 1.06 | 1.21 | 1.32 | 1.64 | 1.77 | 1.83 | 1.86 |
| Guinea-Bissau | 1.50 | 1.51 | 1.50 | 1.45 | 1.60 | 1.54 | 1.53 | 1.49 |
| Guyana | 4.22 | 5.31 | 5.62 | 5.35 | 6.01 | 7.21 | 6.61 | 6.47 |
| Haiti | 0.84 | 0.84 | 0.91 | 1.15 | 1.15 | 1.23 | 1.23 | 1.22 |
| Honduras | 1.87 | 1.89 | 1.82 | 2.28 | 2.32 | 2.43 | 2.38 | 2.45 |
| Hong Kong | 6.65 | 6.83 | 6.91 | 6.87 | 6.82 | 6.95 | 6.88 | 6.63 |
| Hungary | 9.27 | 7.55 | 7.42 | 7.86 | 6.84 | 6.50 | 6.92 | 6.93 |
| Iceland | 17.79 | 12.56 | 13.99 | 14.49 | 15.57 | 14.75 | 15.09 | 14.66 |
| India | 1.58 | 1.68 | 1.76 | 1.87 | 2.26 | 2.52 | 2.60 | 2.67 |
| Indonesia | 2.26 | 2.61 | 2.73 | 2.93 | 3.15 | 3.63 | 3.86 | 4.03 |
| Iran | 5.70 | 7.05 | 7.71 | 9.46 | 10.52 | 10.46 | 11.12 | 11.30 |
| Iraq | 8.87 | 7.28 | 6.50 | 5.76 | 6.86 | 7.87 | 8.54 | 8.93 |
| Ireland | 16.18 | 16.90 | 19.02 | 17.85 | 14.51 | 13.90 | 14.26 | 14.08 |
| Israel and Palestine, State of | 9.28 | 10.57 | 11.50 | 11.26 | 11.64 | 11.02 | 10.75 | 10.30 |
| Italy, San Marino and the Holy See | 9.29 | 9.50 | 9.82 | 9.93 | 8.45 | 7.23 | 7.13 | 7.04 |
| Jamaica | 3.78 | 4.22 | 4.56 | 4.55 | 3.17 | 3.11 | 3.08 | 3.56 |
| Japan | 10.43 | 11.01 | 10.73 | 10.80 | 10.28 | 10.47 | 10.33 | 9.99 |
| Jordan | 3.46 | 3.71 | 3.75 | 4.32 | 3.71 | 3.65 | 3.76 | 3.57 |
| Kazakhstan | 20.94 | 15.09 | 11.69 | 15.39 | 19.20 | 19.77 | 20.27 | 19.98 |
| Kenya | 1.71 | 1.52 | 1.39 | 1.53 | 1.94 | 1.82 | 1.79 | 1.79 |
| Kiribati | 0.46 | 0.45 | 0.59 | 0.86 | 0.75 | 0.78 | 0.79 | 0.80 |
| Kuwait | 22.60 | 40.03 | 40.01 | 49.15 | 39.78 | 35.75 | 34.03 | 33.71 |
| Kyrgyzstan | 7.68 | 2.43 | 2.21 | 2.30 | 2.54 | 3.33 | 3.16 | 3.47 |
| Laos | 1.80 | 1.72 | 1.79 | 1.90 | 2.24 | 3.80 | 5.38 | 5.31 |
| Latvia | 10.48 | 5.31 | 4.48 | 5.36 | 6.13 | 6.20 | 6.20 | 6.51 |
| Lebanon | 2.91 | 5.62 | 5.67 | 5.18 | 5.81 | 5.60 | 5.90 | 5.67 |
| Lesotho | 1.24 | 1.18 | 1.39 | 1.37 | 1.33 | 1.22 | 1.28 | 1.26 |
| Liberia | 0.75 | 0.60 | 0.66 | 0.74 | 0.76 | 0.83 | 0.86 | 0.86 |
| Libya | 18.68 | 19.09 | 15.92 | 16.73 | 16.16 | 11.24 | 12.34 | 12.24 |
| Lithuania | 12.75 | 6.22 | 5.49 | 6.71 | 7.40 | 8.09 | 8.20 | 8.15 |
| Luxembourg | 33.24 | 24.60 | 22.57 | 28.67 | 24.10 | 18.15 | 17.42 | 17.73 |
| Macao | 2.93 | 3.23 | 3.40 | 4.21 | 2.27 | 3.70 | 3.58 | 3.63 |
| Madagascar | 2.04 | 1.83 | 1.65 | 1.45 | 1.37 | 1.29 | 1.23 | 1.25 |
| Malawi | 0.52 | 0.52 | 0.58 | 0.56 | 0.62 | 0.61 | 0.63 | 0.66 |
| Malaysia | 5.10 | 6.38 | 7.85 | 9.52 | 9.91 | 10.42 | 9.71 | 10.12 |
| Maldives | 0.63 | 1.45 | 2.34 | 2.26 | 2.76 | 4.05 | 4.12 | 4.16 |
| Mali | 1.46 | 1.41 | 1.50 | 1.63 | 1.78 | 1.86 | 1.97 | 2.02 |
| Malta | 6.90 | 6.85 | 5.98 | 7.23 | 7.28 | 5.03 | 4.72 | 4.76 |
| Martinique | 5.07 | 5.65 | 5.45 | 5.24 | 5.67 | 5.52 | 6.08 | 5.91 |
| Mauritania | 3.07 | 3.59 | 3.22 | 3.18 | 3.03 | 3.07 | 3.02 | 2.98 |
| Mauritius | 1.80 | 2.06 | 2.80 | 3.07 | 4.10 | 4.50 | 4.77 | 4.75 |
| Mexico | 5.33 | 5.52 | 6.12 | 6.44 | 6.50 | 6.22 | 6.17 | 6.13 |
| Moldova | 8.59 | 3.82 | 2.37 | 2.73 | 2.84 | 2.85 | 2.91 | 3.06 |
| Mongolia | 11.60 | 10.23 | 10.34 | 9.59 | 13.07 | 15.30 | 18.80 | 19.48 |
| Morocco | 1.74 | 1.84 | 1.99 | 2.34 | 2.51 | 2.73 | 2.79 | 2.80 |
| Mozambique | 0.60 | 0.57 | 0.61 | 0.72 | 0.63 | 0.89 | 1.02 | 1.07 |
| Myanmar/Burma | 1.64 | 1.79 | 1.84 | 2.12 | 2.19 | 2.40 | 2.70 | 2.70 |
| Namibia | 4.81 | 4.07 | 4.27 | 5.03 | 4.45 | 4.77 | 4.84 | 4.65 |
| Nepal | 1.55 | 1.45 | 1.41 | 1.35 | 1.42 | 1.50 | 1.69 | 1.73 |
| Netherlands | 16.93 | 16.04 | 15.82 | 14.82 | 13.84 | 12.81 | 13.04 | 12.99 |
| New Caledonia | 11.16 | 10.53 | 13.66 | 14.81 | 15.49 | 18.13 | 19.53 | 19.79 |
| New Zealand | 20.12 | 20.02 | 20.76 | 20.85 | 19.06 | 18.41 | 18.28 | 17.88 |
| Nicaragua | 2.48 | 2.31 | 2.63 | 2.69 | 2.74 | 3.14 | 3.11 | 3.04 |
| Niger | 1.47 | 1.55 | 1.46 | 1.50 | 1.46 | 1.52 | 1.54 | 1.56 |
| Nigeria | 2.72 | 3.22 | 3.08 | 2.61 | 2.10 | 2.04 | 1.96 | 2.01 |
| North Korea | 8.14 | 5.18 | 4.33 | 4.54 | 3.17 | 2.11 | 1.92 | 1.74 |
| North Macedonia | 7.11 | 5.64 | 5.53 | 5.96 | 5.63 | 5.05 | 5.19 | 4.91 |
| Norway | 14.71 | 15.24 | 15.62 | 15.59 | 14.90 | 13.67 | 13.21 | 13.26 |
| Oman | 16.94 | 16.79 | 21.21 | 24.65 | 25.81 | 26.62 | 25.15 | 24.85 |
| Pakistan | 1.89 | 1.98 | 2.04 | 2.17 | 2.23 | 2.29 | 2.48 | 2.51 |
| Palau | 152.61 | 145.39 | 115.59 | 91.76 | 107.09 | 58.53 | 57.39 | 58.27 |
| Panama | 2.85 | 3.31 | 3.24 | 3.79 | 4.20 | 4.26 | 4.02 | 3.85 |
| Papua New Guinea | 0.79 | 0.87 | 1.00 | 1.43 | 0.95 | 1.66 | 1.75 | 1.88 |
| Paraguay | 4.94 | 5.35 | 4.75 | 4.53 | 5.94 | 6.22 | 6.33 | 6.27 |
| Peru | 2.03 | 2.15 | 2.18 | 2.23 | 2.67 | 2.87 | 2.82 | 2.81 |
| Philippines | 1.68 | 1.86 | 1.86 | 1.82 | 1.79 | 2.00 | 2.20 | 2.23 |
| Poland | 13.43 | 12.45 | 10.80 | 10.93 | 11.19 | 10.57 | 11.20 | 11.15 |
| Portugal | 5.85 | 6.77 | 7.82 | 7.91 | 6.46 | 6.52 | 7.04 | 6.76 |
| Puerto Rico | 1.01 | 0.90 | 1.08 | 1.24 | 1.26 | 1.77 | 1.65 | 1.62 |
| Qatar | 57.02 | 61.26 | 107.80 | 89.36 | 70.89 | 68.70 | 66.14 | 66.23 |
| Réunion | 2.00 | 2.80 | 3.51 | 3.65 | 3.72 | 3.46 | 3.40 | 3.54 |
| Romania | 10.40 | 7.43 | 6.01 | 6.57 | 5.79 | 5.79 | 6.01 | 6.08 |
| Russia | 20.68 | 15.13 | 14.45 | 15.23 | 15.34 | 15.50 | 15.67 | 16.07 |
| Rwanda | 0.49 | 0.49 | 0.45 | 0.50 | 0.55 | 0.55 | 0.54 | 0.54 |
| Saint Helena, Ascension and Tristan da Cunha | 2.44 | 1.69 | 2.83 | 3.05 | 3.60 | 4.62 | 4.96 | 5.15 |
| Saint Kitts and Nevis | 2.28 | 2.88 | 4.38 | 4.50 | 4.92 | 5.48 | 3.88 | 3.76 |
| Saint Lucia | 1.85 | 1.98 | 2.67 | 2.70 | 2.86 | 3.35 | 2.88 | 2.82 |
| Saint Pierre and Miquelon | 38.55 | 12.27 | 9.67 | 11.51 | 13.03 | 16.37 | 9.56 | 9.27 |
| Saint Vincent and the Grenadines | 1.12 | 1.68 | 1.65 | 2.20 | 2.34 | 2.63 | 1.84 | 1.80 |
| Samoa | 1.73 | 1.69 | 1.80 | 1.99 | 2.05 | 2.87 | 2.90 | 2.94 |
| São Tomé and Príncipe | 0.74 | 0.85 | 0.83 | 1.01 | 1.14 | 1.11 | 1.17 | 1.18 |
| Saudi Arabia | 14.07 | 15.08 | 16.55 | 18.99 | 22.07 | 23.89 | 23.29 | 22.37 |
| Senegal | 1.28 | 1.26 | 1.36 | 1.42 | 1.49 | 1.55 | 1.56 | 1.55 |
| Serbia and Montenegro | 8.39 | 5.95 | 8.17 | 10.03 | 10.35 | 10.29 | 10.38 | 10.08 |
| Seychelles | 5.18 | 6.06 | 11.89 | 13.02 | 11.60 | 11.52 | 12.60 | 13.15 |
| Sierra Leone | 0.86 | 0.80 | 0.66 | 0.79 | 0.81 | 0.84 | 0.87 | 0.87 |
| Singapore | 11.29 | 13.09 | 14.98 | 11.38 | 11.62 | 12.04 | 12.28 | 12.18 |
| Slovakia | 14.02 | 10.31 | 9.51 | 9.65 | 9.18 | 8.21 | 8.74 | 8.73 |
| Slovenia | 11.41 | 10.60 | 10.63 | 12.17 | 11.14 | 9.54 | 9.90 | 9.85 |
| Solomon Islands | 0.84 | 0.80 | 0.71 | 0.70 | 0.68 | 0.74 | 0.84 | 0.85 |
| Somalia | 3.20 | 3.03 | 2.84 | 2.72 | 2.25 | 2.03 | 1.95 | 1.91 |
| South Africa | 10.58 | 9.81 | 9.66 | 11.06 | 11.03 | 10.30 | 10.15 | 10.00 |
| South Korea | 7.50 | 10.26 | 11.63 | 11.90 | 13.53 | 14.14 | 14.60 | 14.82 |
| Spain and Andorra | 7.58 | 8.08 | 9.58 | 10.33 | 8.04 | 7.54 | 7.67 | 7.54 |
| Sri Lanka | 1.22 | 1.27 | 1.41 | 1.57 | 1.58 | 1.91 | 1.98 | 1.99 |
| Sudan and South Sudan | 2.20 | 2.46 | 2.65 | 2.76 | 2.66 | 2.51 | 2.45 | 2.42 |
| Suriname | 6.74 | 5.92 | 5.05 | 5.11 | 5.22 | 5.72 | 5.34 | 5.16 |
| Sweden | 9.26 | 9.53 | 9.02 | 9.09 | 8.31 | 6.76 | 6.72 | 6.47 |
| Switzerland and Liechtenstein | 8.18 | 7.66 | 7.51 | 7.60 | 7.05 | 5.94 | 5.80 | 5.61 |
| Syria | 4.86 | 5.27 | 5.02 | 4.77 | 4.35 | 2.37 | 2.49 | 2.33 |
| Taiwan | 6.98 | 8.99 | 11.63 | 14.90 | 13.35 | 12.99 | 13.58 | 13.51 |
| Tajikistan | 4.19 | 1.98 | 1.72 | 1.73 | 1.53 | 1.73 | 2.01 | 2.13 |
| Tanzania | 1.18 | 1.19 | 1.16 | 1.20 | 1.19 | 1.32 | 1.27 | 1.27 |
| Thailand | 3.68 | 4.69 | 4.63 | 5.58 | 6.11 | 6.31 | 6.29 | 6.28 |
| The Gambia | 0.99 | 0.95 | 0.98 | 1.00 | 1.13 | 1.00 | 0.96 | 0.96 |
| Timor-Leste | 0.92 | 1.03 | 1.27 | 2.04 | 4.50 | 4.99 | 3.98 | 3.88 |
| Togo | 0.86 | 0.76 | 0.96 | 0.97 | 1.14 | 1.14 | 1.15 | 1.21 |
| Tonga | 1.87 | 2.06 | 1.90 | 2.07 | 1.96 | 2.20 | 2.08 | 2.09 |
| Trinidad and Tobago | 14.18 | 14.68 | 21.37 | 38.07 | 44.84 | 39.55 | 35.65 | 34.60 |
| Tunisia | 2.81 | 2.88 | 3.33 | 3.51 | 3.88 | 3.85 | 3.69 | 3.66 |
| Turkmenistan | 21.35 | 13.20 | 15.41 | 19.83 | 19.21 | 22.85 | 21.70 | 21.50 |
| Turks and Caicos Islands | 0.40 | 1.24 | 3.42 | 4.03 | 5.35 | 6.31 | 6.93 | 6.65 |
| Türkiye | 4.10 | 4.32 | 5.02 | 4.88 | 5.77 | 6.54 | 7.22 | 7.07 |
| Uganda | 0.89 | 0.85 | 0.86 | 0.87 | 1.08 | 1.05 | 1.07 | 1.06 |
| Ukraine | 18.44 | 11.36 | 9.13 | 9.38 | 8.56 | 6.64 | 6.13 | 6.32 |
| United Arab Emirates | 43.39 | 43.92 | 38.70 | 35.75 | 26.37 | 28.97 | 29.92 | 29.09 |
| United Kingdom | 13.49 | 12.50 | 11.84 | 11.33 | 9.41 | 7.77 | 7.15 | 6.97 |
| United States | 24.39 | 24.57 | 25.52 | 24.09 | 21.67 | 19.71 | 18.91 | 19.27 |
| Uruguay | 9.16 | 10.31 | 9.97 | 11.01 | 11.39 | 11.82 | 11.39 | 11.28 |
| Uzbekistan | 8.15 | 6.61 | 7.00 | 6.77 | 6.29 | 5.83 | 5.36 | 5.32 |
| Vanuatu | 3.18 | 2.84 | 2.78 | 2.51 | 2.73 | 2.59 | 2.56 | 2.54 |
| Venezuela | 8.16 | 8.43 | 8.68 | 8.84 | 9.27 | 8.22 | 6.87 | 6.52 |
| Vietnam | 1.51 | 1.73 | 2.05 | 2.68 | 3.32 | 3.88 | 3.97 | 4.34 |
| Western Sahara | 1.83 | 1.75 | 1.78 | 1.40 | 1.29 | 1.19 | 1.10 | 1.09 |
| Yemen | 1.44 | 1.49 | 1.78 | 2.11 | 2.28 | 1.27 | 1.07 | 1.05 |
| Zambia | 1.90 | 1.56 | 1.42 | 1.36 | 1.34 | 1.45 | 1.58 | 1.62 |
| Zimbabwe | 3.33 | 2.62 | 2.65 | 2.11 | 1.98 | 1.94 | 1.74 | 1.85 |
BP (2021), Statistical Review of World Energy (link), Last access July 2021.
IEA (2019), Energy balance statistics for 1970-2017 (link), Data release 2019.
Olivier, J.G.J. and Peters, J.A.H.W., Trend in Global CO2 and GHG Emissions 2021 Report, PBL Report, forthcoming, 2021.
IFA (2021), Urea consumption (updates 2010-2018) and production (updates 2008-2019) statistics, 2021 (link)
IMF/World Economic Outlook Database (2021) (link) last access June 2021.
UNDP (2019), population statistics (2019), World Population Prospects (WPP), The 2019 Revision Report United Nations, Department of Economic and Social Affairs, Population Division, 2019.
USGS (2021), USGS Commodity Statistics (June 2021), (link), 2021.
WB (2021), data of GDP, (PPP constant 2017 international $) (expressed in 1000 US dollar, and adjusted to the Purchasing Power Parity of 2017) for 1990-2020, World Bank, July 2021
World Steel Association, worldsteel (2021), Steel Statistical Yearbook 2020 concise version
For more information or data: JRC-EDGAR@ec.europa.eu