2022 report
Since the beginning of 21st century and until 2019, global GHG emissions had followed an increasing trend mainly due to the increase in CO2 emissions from China and the other emerging economies. As a result, the atmospheric concentrations of greenhouse gases substantially increased enhancing the natural greenhouse effect, which may negatively affect the life on the Earth.
In 2020 global fossil CO2 emissions decreased by 5.3% in comparison to 2019, mainly because of the COVID-19 pandemic. However, in 2021, global emissions bounced back almost to the level of 2019, reaching 37.9 Gt, just 0.36% lower than in 2019, with the world getting back to pre-pandemic CO2 emission levels.
In the framework of UNFCCC, countries are developing national emissions inventories and propose/implement actions to mitigate GHG emissions. CO2 emissions, which are the main responsible for global warming are still increasing at world level despite climate change mitigation agreements. In this context, EDGAR provides an independent estimate of greenhouse gases for each world country, based on a robust and consistent methodology stemming from the latest IPCC guidelines and most recent activity data. Following the latest update released in September 2022, emission data are now available for fossil CO2 for each country for the time period 1970-2021 while national emissions for other GHGs are available for 1970-2018.
EDGARv7.0 launches the community GHG emissions database, changing to IEA CO2 data to harmonise CO2 emission estimates and beginning a process of recognising the essential role of the providers of the underlying international statistics to EDGAR.
In 2021, China, the United States, the EU27, India, Russia and Japan remained the world’s largest CO2 emitters. Together they account for 49.2% of global population, 62.4% of global Gross Domestic Product, 66.4% of global fossil fuel consumption and 67.8% of global fossil CO2 emissions. All six increased their fossil CO2 emissions in 2021 compared to 2020, with India and Russia having the largest increases in relative terms (10.5% and 8.1%, respectively).
Among the 16 major emitters accounting for more than 1% of global CO2 emissions, seven countries (China, India, Russia, Iran, Saudi Arabia, Brazil, and Türkiye) have higher CO2 emissions in 2021 than in 2019 with Türkiye showing the highest biannual increase (+7.9%).
By comparison, the EU27 and eight other countries (United States, Japan, South Korea, Indonesia, Canada, South Africa, Mexico, and Australia) emitted less in 2021 than in 2019, with Mexico showing the largest biannual decrease (-13%).
Similarly, global per capita CO2 emissions bounced back to the pre-pandemic levels, bringing back with the overall have increased from 1990 to 2021 to 13% (from 4.26 t CO2/cap/yr to 4.81 t CO2/cap/yr).
In 2020, regardless the important decrease of GDP observed in the majority of world countries, global fossil CO2 emissions per unit of GDP continued their decreasing trend. On the contrary in 2021 in several countries emissions bounced back more than GDP recovery, resulting in an increase of CO2 emissions per unit of GDP (+1.1% in EU27, +0.7% in US, +1.5% in India, +3.1% in Russia and + 1.1% in Japan)
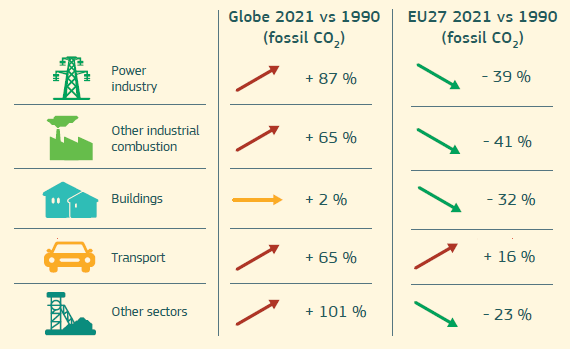
EU27, total fossil CO2 emissions increased by 6.5% (0.17 Gt) in 2021 compared with 2020. However, this increase is just half of the reduction that took place between 2019 and 2020 (-10.8%), consequently the EU27 emissions fell by 5% between 2021 and 2019.
From a longer-term perspective, fossil CO2 emissions in the EU27 have followed a decreasing trend over the past two decades, and in 2021 they were 2.78 Gt, i.e., 27.4% below the 1990 level. The EU27’s share of global emissions has also decreased over the last years, from 16.8% in 1990 to 8.5% in 2015 and 7.3% in 2021.
The data are presented in the table below for key years, to allow easy comparison of different countries.
"Country names" are consistent with the Interinstitutional Style Guide of the European Commission, the "Short name" definition listed in the "List of countries, territories and currencies" table has been used (as of 01/09/2022)
EDGAR data are expressed in metric units.
| Country | 1990 | 2000 | 2005 | 2010 | 2015 | 2019 | 2020 | 2021 |
|---|---|---|---|---|---|---|---|---|
| unit | ton CO2/cap | ton CO2/cap | ton CO2/cap | ton CO2/cap | ton CO2/cap | ton CO2/cap | ton CO2/cap | ton CO2/cap |
| EU27 | 9.09 | 8.35 | 8.50 | 7.77 | 7.01 | 6.59 | 5.87 | 6.25 |
| GLOBAL TOTAL | 4.26 | 4.21 | 4.61 | 4.91 | 4.92 | 4.93 | 4.62 | 4.81 |
| Afghanistan | 0.24 | 0.05 | 0.05 | 0.28 | 0.25 | 0.22 | 0.22 | 0.21 |
| Albania | 2.03 | 1.05 | 1.37 | 1.57 | 1.68 | 1.71 | 1.60 | 1.56 |
| Algeria | 2.62 | 2.69 | 2.96 | 3.23 | 4.05 | 4.17 | 3.90 | 3.93 |
| Angola | 0.93 | 1.01 | 0.82 | 0.98 | 1.17 | 0.80 | 0.70 | 0.72 |
| Anguilla | 0.73 | 1.40 | 1.08 | 1.74 | 1.92 | 1.82 | 1.49 | 1.69 |
| Antigua and Barbuda | 6.41 | 5.90 | 7.98 | 9.05 | 10.83 | 8.13 | 6.65 | 7.34 |
| Argentina | 3.08 | 3.76 | 4.05 | 4.39 | 4.59 | 4.06 | 3.78 | 4.12 |
| Armenia | 5.85 | 1.19 | 1.53 | 1.55 | 1.86 | 2.13 | 2.17 | 2.30 |
| Aruba | 8.44 | 10.38 | 13.69 | 13.11 | 15.41 | 13.08 | 10.75 | 11.91 |
| Australia | 16.33 | 18.61 | 19.09 | 18.46 | 16.64 | 16.21 | 14.83 | 14.31 |
| Austria | 8.12 | 8.42 | 9.84 | 8.89 | 7.87 | 7.98 | 7.21 | 7.50 |
| Azerbaijan | 7.54 | 3.45 | 3.57 | 2.73 | 3.38 | 3.64 | 3.56 | 3.65 |
| Bahamas | 11.04 | 11.41 | 8.60 | 8.90 | 9.37 | 10.92 | 8.92 | 9.86 |
| Bahrain | 24.17 | 26.73 | 26.28 | 23.23 | 24.40 | 22.44 | 21.48 | 21.50 |
| Bangladesh | 0.14 | 0.21 | 0.28 | 0.39 | 0.52 | 0.62 | 0.61 | 0.62 |
| Barbados | 5.25 | 5.94 | 6.57 | 7.02 | 7.74 | 6.67 | 5.53 | 6.13 |
| Belarus | 10.67 | 5.73 | 6.37 | 7.04 | 6.31 | 6.58 | 6.06 | 6.21 |
| Belgium | 11.66 | 12.23 | 11.32 | 10.54 | 9.10 | 8.67 | 7.81 | 8.22 |
| Belize | 1.75 | 2.03 | 2.27 | 2.31 | 2.63 | 1.71 | 1.40 | 1.57 |
| Benin | 0.08 | 0.23 | 0.36 | 0.56 | 0.55 | 0.69 | 0.66 | 0.69 |
| Bermuda | 10.83 | 8.50 | 11.60 | 14.52 | 14.49 | 14.66 | 12.14 | 13.66 |
| Bhutan | 0.34 | 0.73 | 0.84 | 1.27 | 1.65 | 2.29 | 2.13 | 2.34 |
| Bolivia | 0.96 | 0.99 | 1.10 | 1.53 | 1.92 | 1.99 | 1.75 | 1.92 |
| Bosnia and Herzegovina | 5.53 | 3.81 | 4.48 | 5.98 | 5.91 | 6.50 | 6.45 | 4.40 |
| Botswana | 2.05 | 2.42 | 2.41 | 1.74 | 3.21 | 3.11 | 2.78 | 2.85 |
| Brazil | 1.53 | 2.08 | 2.06 | 2.29 | 2.56 | 2.25 | 2.06 | 2.28 |
| British Virgin Islands | 2.95 | 6.25 | 12.80 | 13.52 | 13.64 | 6.15 | 5.02 | 5.53 |
| Brunei | 12.92 | 14.67 | 14.17 | 18.88 | 15.61 | 16.72 | 16.20 | 16.05 |
| Bulgaria | 8.95 | 5.98 | 6.76 | 6.51 | 6.74 | 6.16 | 5.45 | 6.33 |
| Burkina Faso | 0.05 | 0.09 | 0.09 | 0.14 | 0.21 | 0.25 | 0.24 | 0.25 |
| Burundi | 0.05 | 0.05 | 0.03 | 0.04 | 0.04 | 0.06 | 0.06 | 0.06 |
| Cabo Verde | 0.19 | 0.73 | 1.40 | 1.61 | 1.42 | 1.54 | 1.49 | 1.59 |
| Cambodia | 0.05 | 0.16 | 0.20 | 0.36 | 0.55 | 0.98 | 0.99 | 1.00 |
| Cameroon | 0.41 | 0.38 | 0.32 | 0.39 | 0.41 | 0.41 | 0.38 | 0.38 |
| Canada | 16.01 | 17.73 | 17.90 | 16.52 | 16.32 | 16.32 | 14.59 | 14.86 |
| Cayman Islands | 12.03 | 11.52 | 13.03 | 14.08 | 15.98 | 14.84 | 12.10 | 13.24 |
| Central African Republic | 0.07 | 0.08 | 0.07 | 0.05 | 0.05 | 0.06 | 0.05 | 0.05 |
| Chad | 0.05 | 0.03 | 0.05 | 0.05 | 0.11 | 0.14 | 0.13 | 0.13 |
| Chile | 2.49 | 3.50 | 3.65 | 4.24 | 4.73 | 5.13 | 4.52 | 4.61 |
| China | 2.07 | 2.89 | 4.80 | 6.84 | 7.71 | 8.29 | 8.39 | 8.73 |
| Colombia | 1.53 | 1.52 | 1.39 | 1.42 | 1.68 | 1.67 | 1.45 | 1.53 |
| Comoros | 0.12 | 0.19 | 0.24 | 0.24 | 0.21 | 0.35 | 0.30 | 0.31 |
| Congo | 0.98 | 1.41 | 1.17 | 1.21 | 1.16 | 1.32 | 1.31 | 1.26 |
| Cook Islands | 2.19 | 3.61 | 4.22 | 4.50 | 5.40 | 5.99 | 6.00 | 6.41 |
| Costa Rica | 0.95 | 1.31 | 1.49 | 1.60 | 1.61 | 1.69 | 1.44 | 1.59 |
| Côte d’Ivoire | 0.25 | 0.42 | 0.36 | 0.37 | 0.50 | 0.53 | 0.52 | 0.54 |
| Croatia | 5.27 | 4.43 | 5.40 | 4.96 | 4.36 | 4.47 | 4.18 | 4.40 |
| Cuba | 3.64 | 2.60 | 2.32 | 2.49 | 2.57 | 2.26 | 1.90 | 2.14 |
| Curaçao | 18.20 | 42.93 | 46.62 | 30.05 | 33.61 | 13.60 | 11.20 | 12.41 |
| Cyprus | 5.83 | 7.38 | 7.64 | 7.13 | 5.88 | 6.06 | 5.33 | 5.55 |
| Czechia | 15.76 | 12.67 | 12.38 | 11.28 | 9.98 | 9.61 | 8.69 | 9.19 |
| Democratic Republic of the Congo | 0.10 | 0.04 | 0.05 | 0.05 | 0.05 | 0.04 | 0.04 | 0.04 |
| Denmark | 10.41 | 10.11 | 9.48 | 8.85 | 6.19 | 5.31 | 4.48 | 4.69 |
| Djibouti | 1.99 | 1.16 | 1.05 | 1.02 | 0.84 | 0.65 | 0.57 | 0.60 |
| Dominica | 0.80 | 2.35 | 4.66 | 5.27 | 5.64 | 2.82 | 2.33 | 2.56 |
| Dominican Republic | 1.12 | 2.22 | 2.04 | 2.11 | 2.27 | 2.51 | 2.25 | 2.47 |
| Ecuador | 1.72 | 1.75 | 2.06 | 2.51 | 2.62 | 2.38 | 1.96 | 2.34 |
| Egypt | 1.59 | 1.82 | 2.31 | 2.53 | 2.57 | 2.65 | 2.36 | 2.48 |
| El Salvador | 0.50 | 0.99 | 1.17 | 1.13 | 1.20 | 1.33 | 1.14 | 1.26 |
| Equatorial Guinea | 0.15 | 4.88 | 12.08 | 11.30 | 6.48 | 4.82 | 4.74 | 4.82 |
| Eritrea | 0.10 | 0.20 | 0.15 | 0.12 | 0.13 | 0.17 | 0.14 | 0.15 |
| Estonia | 23.94 | 12.12 | 14.50 | 16.58 | 15.12 | 11.54 | 10.66 | 11.49 |
| Eswatini | 1.59 | 2.68 | 2.71 | 2.47 | 0.86 | 1.12 | 1.01 | 1.03 |
| Ethiopia | 0.04 | 0.06 | 0.07 | 0.08 | 0.13 | 0.18 | 0.16 | 0.17 |
| Falkland Islands | 7.90 | 20.83 | 73.47 | 85.13 | 84.18 | 18.46 | 17.10 | 18.11 |
| Faroes | 0.03 | 0.04 | 0.04 | 0.04 | 0.04 | 0.04 | 0.04 | 0.04 |
| Fiji | 1.38 | 1.93 | 2.17 | 2.00 | 1.72 | 1.81 | 1.81 | 1.86 |
| Finland | 11.46 | 11.15 | 11.09 | 12.27 | 8.40 | 7.88 | 6.85 | 6.97 |
| France and Monaco | 6.76 | 6.74 | 6.66 | 6.00 | 5.19 | 4.94 | 4.25 | 4.58 |
| French Guiana | 5.81 | 3.36 | 3.68 | 3.97 | 2.79 | 2.78 | 2.56 | 2.70 |
| French Polynesia | 4.22 | 3.28 | 3.81 | 3.76 | 3.44 | 3.24 | 3.23 | 3.32 |
| Gabon | 6.48 | 5.37 | 4.56 | 3.63 | 3.34 | 2.65 | 2.56 | 2.52 |
| Georgia | 6.42 | 1.14 | 1.11 | 1.47 | 2.60 | 2.99 | 2.88 | 3.00 |
| Germany | 12.88 | 10.78 | 10.33 | 10.11 | 9.65 | 8.51 | 7.62 | 8.06 |
| Ghana | 0.22 | 0.32 | 0.34 | 0.46 | 0.57 | 0.70 | 0.70 | 0.75 |
| Gibraltar | 4.93 | 10.94 | 12.66 | 14.31 | 17.15 | 20.57 | 18.62 | 19.13 |
| Greece | 7.72 | 8.71 | 9.28 | 7.87 | 6.29 | 5.65 | 4.70 | 4.82 |
| Greenland | 0.06 | 0.06 | 10.91 | 11.52 | 9.31 | 9.04 | 8.01 | 8.15 |
| Grenada | 1.38 | 2.25 | 3.89 | 4.60 | 5.14 | 3.44 | 2.83 | 3.16 |
| Guadeloupe | 4.10 | 4.47 | 4.75 | 5.39 | 4.52 | 4.35 | 3.64 | 4.03 |
| Guatemala | 0.42 | 0.83 | 0.89 | 0.81 | 1.05 | 1.13 | 0.97 | 1.11 |
| Guinea | 0.19 | 0.19 | 0.20 | 0.25 | 0.23 | 0.24 | 0.23 | 0.24 |
| Guinea-Bissau | 0.20 | 0.19 | 0.22 | 0.22 | 0.20 | 0.15 | 0.15 | 0.16 |
| Guyana | 1.58 | 2.21 | 1.98 | 2.36 | 2.70 | 3.62 | 3.40 | 3.65 |
| Haiti | 0.16 | 0.20 | 0.20 | 0.26 | 0.32 | 0.31 | 0.26 | 0.28 |
| Honduras | 0.48 | 0.78 | 0.97 | 1.01 | 1.11 | 1.07 | 0.90 | 0.99 |
| Hong Kong | 6.07 | 6.23 | 6.25 | 6.00 | 6.09 | 5.80 | 4.35 | 4.37 |
| Hungary | 6.96 | 5.71 | 5.95 | 5.23 | 4.85 | 5.27 | 5.13 | 5.29 |
| Iceland | 9.19 | 10.22 | 10.76 | 11.70 | 11.09 | 9.55 | 7.90 | 8.40 |
| India | 0.69 | 0.94 | 1.06 | 1.41 | 1.73 | 1.87 | 1.73 | 1.90 |
| Indonesia | 0.89 | 1.40 | 1.59 | 1.80 | 1.99 | 2.40 | 2.17 | 2.19 |
| Iran | 3.64 | 5.33 | 6.64 | 7.72 | 7.93 | 8.09 | 8.27 | 8.43 |
| Iraq | 3.97 | 3.76 | 3.23 | 3.62 | 3.80 | 4.50 | 3.99 | 4.17 |
| Ireland | 9.21 | 11.52 | 11.24 | 8.92 | 8.16 | 7.59 | 6.74 | 7.11 |
| Israel and Palestine, State of | 7.85 | 9.89 | 9.43 | 9.73 | 8.45 | 7.53 | 6.88 | 6.74 |
| Italy, San Marino and the Holy See | 7.53 | 7.99 | 8.47 | 7.15 | 5.98 | 5.65 | 5.00 | 5.41 |
| Jamaica | 3.11 | 3.85 | 3.87 | 2.72 | 2.47 | 2.91 | 2.48 | 2.77 |
| Japan | 9.41 | 9.82 | 10.02 | 9.54 | 9.71 | 9.00 | 8.34 | 8.60 |
| Jordan | 2.83 | 3.23 | 3.56 | 2.87 | 2.80 | 2.50 | 2.30 | 2.35 |
| Kazakhstan | 15.22 | 8.73 | 11.75 | 14.86 | 11.27 | 11.99 | 11.34 | 11.14 |
| Kenya | 0.28 | 0.27 | 0.25 | 0.32 | 0.37 | 0.44 | 0.39 | 0.41 |
| Kiribati | 0.23 | 0.42 | 0.69 | 0.60 | 0.53 | 0.60 | 0.59 | 0.61 |
| Kuwait | 15.42 | 26.49 | 33.05 | 28.80 | 24.00 | 22.76 | 21.18 | 22.49 |
| Kyrgyzstan | 5.42 | 0.99 | 1.08 | 1.21 | 1.78 | 1.68 | 1.54 | 1.69 |
| Laos | 0.06 | 0.18 | 0.23 | 0.47 | 1.34 | 2.75 | 2.82 | 2.83 |
| Latvia | 7.67 | 3.18 | 3.66 | 4.31 | 3.93 | 4.23 | 3.67 | 3.85 |
| Lebanon | 2.21 | 4.73 | 4.16 | 4.76 | 4.59 | 4.57 | 4.15 | 4.33 |
| Lesotho | 0.08 | 0.21 | 0.23 | 0.28 | 0.26 | 0.30 | 0.27 | 0.28 |
| Liberia | 0.22 | 0.16 | 0.23 | 0.22 | 0.26 | 0.27 | 0.26 | 0.28 |
| Libya | 7.34 | 9.20 | 9.95 | 10.31 | 8.63 | 9.02 | 7.34 | 9.38 |
| Lithuania | 9.56 | 3.37 | 4.22 | 4.47 | 4.58 | 4.90 | 4.75 | 4.87 |
| Luxembourg | 30.78 | 20.28 | 26.59 | 22.17 | 16.49 | 16.25 | 13.51 | 13.82 |
| Macao | 2.72 | 3.72 | 4.36 | 3.24 | 4.35 | 4.01 | 3.99 | 4.01 |
| Madagascar | 0.07 | 0.12 | 0.12 | 0.12 | 0.19 | 0.20 | 0.18 | 0.19 |
| Malawi | 0.10 | 0.13 | 0.12 | 0.14 | 0.08 | 0.10 | 0.08 | 0.09 |
| Malaysia | 3.19 | 5.72 | 7.09 | 7.69 | 8.22 | 8.20 | 7.79 | 7.56 |
| Maldives | 0.42 | 2.44 | 2.21 | 2.92 | 3.58 | 4.69 | 4.64 | 4.74 |
| Mali | 0.05 | 0.08 | 0.08 | 0.14 | 0.19 | 0.28 | 0.27 | 0.28 |
| Malta | 6.45 | 5.45 | 6.56 | 6.33 | 4.01 | 3.97 | 3.74 | 4.00 |
| Martinique | 4.69 | 5.41 | 5.57 | 6.24 | 5.56 | 5.36 | 4.45 | 4.93 |
| Mauritania | 0.38 | 0.44 | 0.53 | 0.62 | 0.63 | 0.86 | 0.83 | 0.87 |
| Mauritius | 1.13 | 2.07 | 2.44 | 2.95 | 3.17 | 3.31 | 3.03 | 3.24 |
| Mexico | 3.41 | 3.91 | 4.14 | 4.09 | 3.90 | 3.64 | 3.00 | 3.09 |
| Moldova | 7.32 | 1.62 | 1.99 | 2.08 | 2.02 | 2.25 | 2.22 | 2.38 |
| Mongolia | 6.02 | 3.78 | 4.40 | 5.38 | 5.92 | 7.44 | 7.64 | 7.69 |
| Morocco | 0.90 | 1.16 | 1.46 | 1.61 | 1.76 | 1.98 | 1.82 | 1.97 |
| Mozambique | 0.09 | 0.09 | 0.13 | 0.15 | 0.23 | 0.28 | 0.25 | 0.26 |
| Myanmar/Burma | 0.11 | 0.22 | 0.23 | 0.17 | 0.37 | 0.72 | 0.72 | 0.72 |
| Namibia | 1.06 | 1.03 | 1.28 | 1.48 | 1.73 | 1.61 | 1.46 | 1.48 |
| Nepal | 0.06 | 0.14 | 0.13 | 0.18 | 0.26 | 0.45 | 0.46 | 0.47 |
| Netherlands | 10.79 | 11.09 | 11.12 | 11.17 | 10.08 | 9.27 | 8.33 | 8.52 |
| New Caledonia | 9.26 | 10.76 | 11.85 | 14.56 | 17.15 | 19.09 | 19.37 | 19.58 |
| New Zealand | 7.07 | 8.72 | 8.97 | 7.82 | 7.80 | 7.95 | 6.89 | 6.69 |
| Nicaragua | 0.48 | 0.75 | 0.82 | 0.81 | 0.90 | 0.83 | 0.70 | 0.77 |
| Niger | 0.08 | 0.06 | 0.06 | 0.09 | 0.11 | 0.10 | 0.09 | 0.10 |
| Nigeria | 0.78 | 0.82 | 0.72 | 0.58 | 0.61 | 0.60 | 0.58 | 0.60 |
| North Korea | 6.50 | 3.22 | 3.34 | 2.15 | 1.11 | 2.27 | 2.36 | 2.41 |
| North Macedonia | 5.62 | 4.45 | 4.70 | 4.44 | 3.82 | 4.13 | 3.43 | 3.59 |
| Norway | 8.82 | 9.54 | 9.56 | 10.08 | 9.08 | 8.03 | 7.65 | 7.70 |
| Oman | 8.60 | 11.17 | 13.14 | 16.92 | 18.88 | 17.29 | 16.63 | 17.95 |
| Pakistan | 0.61 | 0.79 | 0.86 | 0.89 | 0.92 | 0.98 | 0.97 | 1.04 |
| Palau | 142.83 | 110.64 | 87.11 | 103.09 | 56.14 | 57.11 | 56.87 | 60.17 |
| Panama | 1.11 | 1.72 | 2.14 | 2.52 | 2.68 | 3.11 | 2.60 | 2.87 |
| Papua New Guinea | 0.49 | 0.57 | 0.85 | 0.61 | 0.72 | 0.73 | 0.73 | 0.74 |
| Paraguay | 0.54 | 0.71 | 0.68 | 0.86 | 1.02 | 1.25 | 1.17 | 1.24 |
| Peru | 0.96 | 1.12 | 1.15 | 1.56 | 1.74 | 1.75 | 1.40 | 1.64 |
| Philippines | 0.72 | 0.97 | 0.94 | 0.92 | 1.12 | 1.39 | 1.26 | 1.33 |
| Poland | 9.80 | 8.13 | 8.28 | 8.59 | 8.00 | 8.20 | 7.80 | 8.48 |
| Portugal | 4.38 | 6.23 | 6.45 | 5.02 | 5.01 | 4.59 | 3.87 | 3.80 |
| Puerto Rico | 0.25 | 0.44 | 0.62 | 0.63 | 1.14 | 0.34 | 0.33 | 0.35 |
| Qatar | 35.70 | 53.68 | 50.42 | 38.76 | 39.74 | 38.40 | 33.93 | 34.40 |
| Réunion | 1.78 | 3.11 | 3.25 | 3.41 | 3.12 | 3.17 | 2.69 | 2.86 |
| Romania | 7.95 | 4.39 | 4.83 | 4.05 | 4.01 | 4.13 | 3.77 | 4.08 |
| Russia | 16.23 | 11.43 | 12.08 | 12.11 | 12.04 | 13.08 | 12.50 | 13.52 |
| Rwanda | 0.08 | 0.08 | 0.08 | 0.08 | 0.09 | 0.10 | 0.09 | 0.09 |
| Saint Helena, Ascension and Tristan da Cunha | 1.72 | 2.20 | 2.27 | 2.75 | 3.71 | 4.13 | 3.77 | 4.03 |
| Saint Kitts and Nevis | 1.34 | 4.48 | 7.59 | 8.44 | 9.26 | 5.53 | 4.53 | 4.94 |
| Saint Lucia | 1.35 | 2.31 | 3.28 | 3.65 | 4.23 | 4.30 | 3.54 | 3.94 |
| Saint Pierre and Miquelon | 37.93 | 15.12 | 40.39 | 45.79 | 48.81 | 16.44 | 14.29 | 13.25 |
| Saint Vincent and the Grenadines | 0.72 | 1.63 | 3.54 | 3.93 | 4.40 | 2.29 | 1.89 | 2.10 |
| Samoa | 0.75 | 1.16 | 1.25 | 1.43 | 1.60 | 1.74 | 1.74 | 1.78 |
| São Tomé and Príncipe | 0.41 | 0.45 | 0.63 | 0.76 | 0.69 | 0.73 | 0.66 | 0.69 |
| Saudi Arabia | 10.63 | 12.77 | 14.49 | 17.76 | 19.38 | 16.91 | 16.56 | 16.63 |
| Senegal | 0.32 | 0.41 | 0.52 | 0.55 | 0.62 | 0.68 | 0.65 | 0.68 |
| Serbia and Montenegro | 6.56 | 5.03 | 6.26 | 6.23 | 6.08 | 6.18 | 6.18 | 4.23 |
| Seychelles | 4.54 | 10.56 | 11.85 | 10.78 | 10.07 | 10.36 | 10.48 | 10.79 |
| Sierra Leone | 0.18 | 0.11 | 0.11 | 0.12 | 0.14 | 0.12 | 0.12 | 0.12 |
| Singapore | 10.50 | 11.64 | 9.31 | 9.67 | 10.00 | 9.69 | 9.40 | 9.71 |
| Slovakia | 11.44 | 7.62 | 7.81 | 7.38 | 6.35 | 6.39 | 6.07 | 6.88 |
| Slovenia | 8.30 | 7.90 | 9.19 | 8.75 | 7.26 | 7.50 | 6.90 | 6.81 |
| Solomon Islands | 0.51 | 0.63 | 0.67 | 0.70 | 0.55 | 0.50 | 0.49 | 0.50 |
| Somalia | 0.10 | 0.08 | 0.08 | 0.07 | 0.06 | 0.05 | 0.04 | 0.05 |
| South Africa | 8.35 | 7.58 | 8.90 | 8.97 | 8.30 | 8.10 | 7.29 | 7.34 |
| South Korea | 6.32 | 10.21 | 10.60 | 12.09 | 12.72 | 12.67 | 11.75 | 12.13 |
| Spain and Andorra | 5.91 | 7.68 | 8.44 | 6.23 | 5.90 | 5.53 | 4.57 | 4.99 |
| Sri Lanka | 0.25 | 0.61 | 0.74 | 0.68 | 1.04 | 1.21 | 1.16 | 1.13 |
| Sudan and South Sudan | 0.22 | 0.18 | 0.28 | 0.38 | 0.42 | 0.42 | 0.36 | 0.36 |
| Suriname | 3.98 | 3.14 | 3.39 | 3.33 | 4.93 | 4.63 | 4.33 | 4.64 |
| Sweden | 6.78 | 6.63 | 6.25 | 5.90 | 4.73 | 4.20 | 3.85 | 3.82 |
| Switzerland and Liechtenstein | 6.74 | 6.27 | 6.37 | 5.93 | 4.85 | 4.48 | 3.95 | 4.02 |
| Syria | 2.65 | 2.79 | 3.21 | 3.03 | 1.37 | 1.44 | 1.31 | 1.32 |
| Taiwan | 6.00 | 10.30 | 11.83 | 11.72 | 11.95 | 11.71 | 11.29 | 12.07 |
| Tajikistan | 2.32 | 0.46 | 0.48 | 0.41 | 0.61 | 1.04 | 0.97 | 1.05 |
| Tanzania | 0.08 | 0.09 | 0.15 | 0.15 | 0.22 | 0.22 | 0.20 | 0.21 |
| Thailand | 1.66 | 2.77 | 3.49 | 3.65 | 4.06 | 4.06 | 3.83 | 3.88 |
| The Gambia | 0.16 | 0.25 | 0.25 | 0.28 | 0.25 | 0.24 | 0.23 | 0.24 |
| Timor-Leste | 0.00 | 0.26 | 0.34 | 0.30 | 0.53 | 0.42 | 0.41 | 0.40 |
| Togo | 0.20 | 0.25 | 0.23 | 0.39 | 0.21 | 0.26 | 0.25 | 0.26 |
| Tonga | 0.92 | 1.11 | 1.23 | 1.23 | 1.20 | 1.47 | 1.47 | 1.51 |
| Trinidad and Tobago | 10.37 | 14.78 | 26.30 | 29.93 | 26.17 | 23.69 | 21.09 | 21.01 |
| Tunisia | 1.79 | 2.19 | 2.32 | 2.64 | 2.73 | 2.55 | 2.32 | 2.64 |
| Turkmenistan | 12.39 | 8.72 | 11.15 | 12.11 | 13.64 | 12.71 | 11.99 | 13.62 |
| Turks and Caicos Islands | 1.21 | 5.06 | 10.78 | 12.08 | 12.69 | 7.41 | 6.04 | 6.72 |
| Türkiye | 2.79 | 3.58 | 3.60 | 4.30 | 4.69 | 5.03 | 4.97 | 5.32 |
| Uganda | 0.04 | 0.07 | 0.08 | 0.13 | 0.13 | 0.16 | 0.14 | 0.14 |
| Ukraine | 15.22 | 7.32 | 7.53 | 6.74 | 4.94 | 4.56 | 4.35 | 4.28 |
| United Arab Emirates | 30.59 | 28.06 | 26.77 | 20.81 | 22.70 | 20.58 | 19.29 | 19.47 |
| United Kingdom | 10.28 | 9.36 | 9.32 | 7.93 | 6.41 | 5.49 | 4.74 | 4.95 |
| United States | 20.07 | 21.29 | 20.16 | 18.05 | 16.19 | 15.23 | 13.47 | 14.24 |
| Uruguay | 1.27 | 1.67 | 1.66 | 1.90 | 1.98 | 1.92 | 1.80 | 1.94 |
| Uzbekistan | 6.16 | 5.12 | 4.58 | 4.56 | 3.36 | 3.74 | 3.68 | 3.73 |
| Vanuatu | 0.69 | 0.50 | 0.45 | 0.67 | 0.58 | 0.74 | 0.73 | 0.74 |
| Venezuela | 5.17 | 5.63 | 5.83 | 5.98 | 5.54 | 3.62 | 3.02 | 3.12 |
| Vietnam | 0.30 | 0.70 | 1.19 | 1.77 | 2.36 | 3.42 | 3.27 | 3.24 |
| Western Sahara | 0.69 | 0.81 | 0.59 | 0.53 | 0.45 | 0.40 | 0.33 | 0.39 |
| Yemen | 0.59 | 0.88 | 1.07 | 1.11 | 0.53 | 0.42 | 0.38 | 0.39 |
| Zambia | 0.38 | 0.19 | 0.20 | 0.21 | 0.33 | 0.39 | 0.35 | 0.36 |
| Zimbabwe | 1.69 | 1.19 | 0.88 | 0.72 | 0.82 | 0.70 | 0.65 | 0.68 |
Artés, T., Oom, D., De Rigo, D., Durrant, T.H., Maianti, P., Libertà, G. and San-Miguel-Ayanz, J. A global wildfire dataset for the analysis of fire regimes and fire behaviour. Scientific data, 6(1), 1-11 (2019). doi:10.1038/s41597-019-0312-2.
BP Statistical Review of World Energy, June 2022 (www.bp.com/statisticalreview), Last access July 2022.
Grassi, G., Conchedda, G., Federici, S., Abad Viñas, R., Korosuo, A., Melo, J., Rossi, S., Sandker, M., Somogyi, Z., and Tubiello, F. N.: Carbon fluxes from land 2000–2020: bringing clarity on countries’ reporting, Earth Syst. Sci. Data Discuss. [preprint], doi:10.5194/essd-2022-104, in review, 2022.
IATA (2022), International Air Transport Association Statistics, www.iata.org/en/iata-repository/pressroom/fact-sheets/industry-statistics, 2022.
IEA World Energy Balances 2021 Edition, www.iea.org, All rights reserved, as modified by Joint Research Centre, European Commission, 2021a.
IEA Greenhouse Gas Emissions from Energy - 2021 Edition, www.iea.org, 2021b.
IFA (2022), Urea consumption (updates 2010-2019) and production (updates 2020) statistics, 2022, www.ifastat.org/.
FAOSTAT (2022), Statistics Division of the Food and Agricultural Organisation of the UN: www.fao.org/faostat, Last access May 2022.
Marine Benchmark (www.marinebenchmark.com/insights) and International Maritime Organization annual industry outlook (www.ssyonline.com/media/2016/ssy-2022-outlook-final.pdf).
Olivier, J.G.J. and Peters, J.A.H.W., Trend in Global CO2 and GHG Emissions – 2022 Report, PBL Report, forthcoming, 2022.
USGS (2022), USGS Commodity Statistics (June 2022), (www.usgs.gov/centers/nmic/commodity-statistics-and-information), 2022.
WB (2022), data of GDP PPP, (constant 2017 international $) (expressed in 1000 US dollar, and adjusted to the Purchasing Power Parity of 2017) for 1990-2021, World Bank, July 2022.
World Steel Association, (worldsteel) (2021), Steel Statistical Yearbook 2021, worldsteel.org/wp-content/uploads/2021-World-Steel-in-Figures.pdf.
IEA-EDGAR CO2, a component of the EDGAR (Emissions Database for Global Atmospheric Research) Community GHG database version 7.0 (2022) including or based on data from IEA (2021) Greenhouse Gas Emissions from Energy, www.iea.org/data-and-statistics, as modified by the Joint Research Centre.
Crippa, M., Guizzardi, D., Banja, M., Solazzo, E., Muntean, M., Schaaf, E., Pagani, F., Monforti-Ferrario, F., Olivier, J., Quadrelli, R., Risquez Martin, A., Taghavi-Moharamli, P., Grassi, G., Rossi, S., Jacome Felix Oom, D., Branco, A., San-Miguel-Ayanz, J. and Vignati, E., CO2 emissions of all world countries - 2022 Report, EUR 31182 EN, Publications Office of the European Union, Luxembourg, 2022, doi:10.2760/730164, JRC130363
IEA-EDGAR CO2 data are based on data from IEA (2021) Greenhouse Gas Emissions from Energy, www.iea.org/data-and-statistics, as modified by the Joint Research Centre, licensed under CC BY-NC-ND 4.0. Users of the IEA-EDGAR CO2 data should contact the IEA at compliance@iea.org if they wish to use such data outside the terms of the CC-BY-NC-ND 4.0 licence.
Co-authorship and involvement of the EDGAR Community, which includes the IEA for fossil CO2 emissions, in the emission data analysis is highly appreciated. User's comments and requests can be sent via email to the authors. For IEA data, please refer to emissions@iea.org.
Disclaimer: Without prejudice to the rules applying to the information and data made available by the European Union (in particular the European Commission), as available here and to the maximum extent permitted by applicable law, the European Union ("the Union") and the International Energy Agency ("IEA") disclaim all responsibility or liability in relation to any and all information distributed, published or otherwise made available by them on the EDGAR website, in this dataset and/or in this publication. The Union and the IEA provide any such information as-is and as-available, and make no representations, conditions or warranties of any kind concerning this information, whether express, implied, statutory, or other (including, without limitation, any warranties or conditions of title, non-infringement, merchantability, or fitness for a particular purpose). To the maximum extent permitted by applicable law, in no event shall the Union or the IEA be liable to any third party on any legal theory (including, without limitation, negligence) or otherwise for any direct, special, indirect, incidental, consequential, punitive, exemplary, or other losses, costs, expenses, or damages arising out of the distribution, publication, making available or use of any such information.
Crippa, M., Guizzardi, D., Banja, M., Solazzo, E., Muntean, M., Schaaf, E., Pagani, F., Monforti-Ferrario, F., Olivier, J., Quadrelli, R., Risquez Martin, A., Taghavi-Moharamli, P., Grassi, G., Rossi, S., Jacome Felix Oom, D., Branco, A., San-Miguel-Ayanz, J. and Vignati, E., CO2 emissions of all world countries - JRC/IEA/PBL 2022 Report, EUR 31182 EN, Publications Office of the European Union, Luxembourg, 2022, doi:10.2760/730164, JRC130363.
IEA-EDGAR CO2, a component of the EDGAR (Emissions Database for Global Atmospheric Research) Community GHG database version 7.0 (2022) including or based on data from IEA (2021) Greenhouse Gas Emissions from Energy, www.iea.org/data-and-statistics, as modified by the Joint Research Centre.
Users of the data are obliged to acknowledge the source of the data also with reference to the website (link) and/or relevant reports.
For more information or data: JRC-EDGAR@ec.europa.eu. For IEA data, please refer to emissions@iea.org or compliance@iea.org for terms questions.