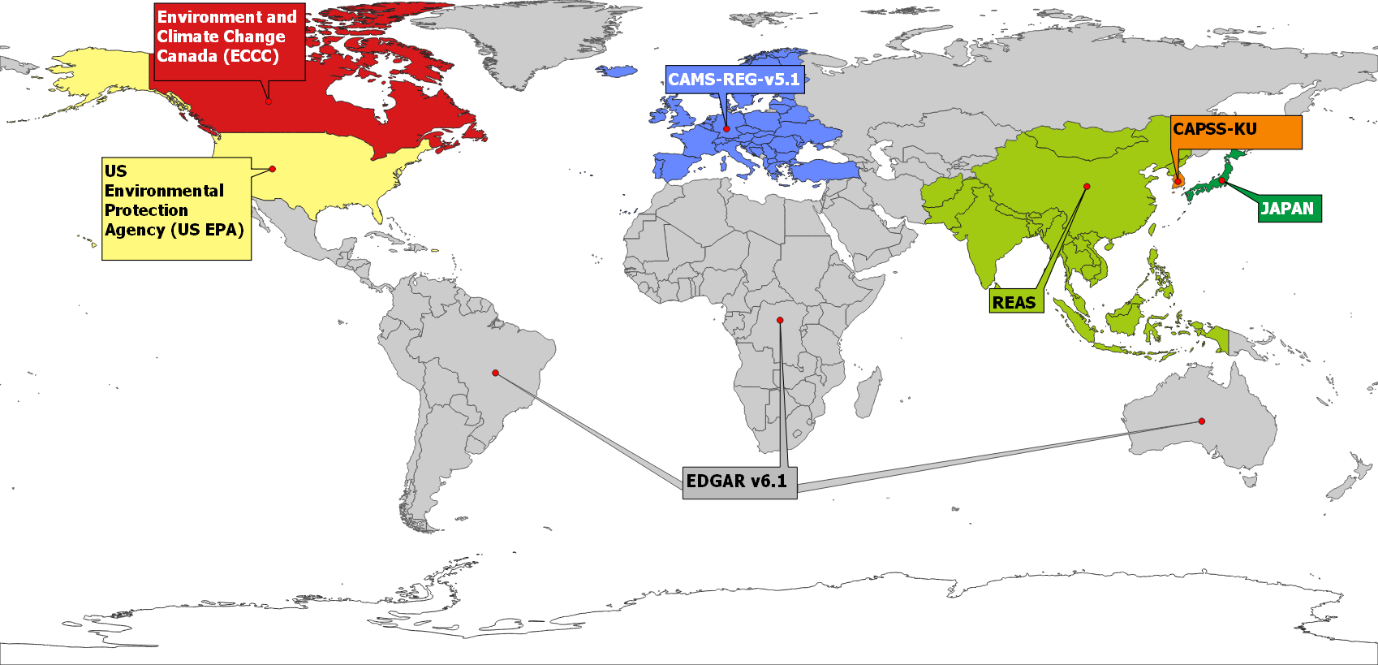
An emission inventory in support to Hemisperic Transport of Air Pollution
The HTAP_v3 mosaic has been developed in the context of the UNECE Air Convention (UNECE Convention on Long-range Transboundary Air Pollution, link: https://unece.org/page404/env-lrtap) as a community effort to improve the scientific knowledge of the intercontinental transport of air pollution over the Northern Hemisphere (http://htap.org/). It consists of a global mosaic of monthly air pollutant (SO2, NOx, CO, NMVOCs, NH3, PM10, PM2.5, BC, OC) emission gridmaps at 0.1x0.1 degree resolution covering the time series 2000-2018 and all anthropogenic emission sectors, with the exception of Land Use, Land Use Change and Forestry. Emission gridmaps have been collected from officially reported data, and specifically from EMEP for Europe (CAMS-REG-v5.1), from the US Environmental Protection Agency (US EPA), Environment and Climate Change Canada (ECCC), REAS for most of the Asian domain, from Japan and CAPPS-KU for Korea. All remaining countries in the world have been covered using EDGARv6.1 air pollutant emission gridmaps. Furthermore, the EDGAR data have been used to complement the officially reported data as gapfilling source in case of missing data for certain sectors, pollutants and years.

Compared to the previous HTAP mosaics (HTAPv1, HTAPv2.2), HTAP_v3 aims at extending the temporal coverage of the air pollutant emissions, their sectoral breakdown and the geographical coverage of the official data. The overall purpose is to provide the scientific inventory and modelling communities a comprehensive tool to develop trend analysis, study the transboundary transport of air pollutants, and help policy makers in addressing and mitigating emissions for relevant sectors.
HTAP_v3 covers the following emission sectors:
| HTAP_v3 main sectors | HTAP_v3 detailed sectors |
|---|---|
| HTAP_1: International Shipping | HTAP_1: International Shipping |
| HTAP_2: Aviation | HTAP_2.1: Domestic Aviation |
| HTAP_2.2: International Aviation | |
| HTAP_3: Energy | HTAP_3: Energy |
| HTAP_4: Industry | HTAP_4.1: Industry |
| HTAP_4.2: Fugitive | |
| HTAP_4.3: Solvents | |
| HTAP_5: Ground Transport | HTAP_5.1: Road Transport |
| HTAP_5.2: Brake and Tyre wear | |
| HTAP_5.3: Domestic shipping | |
| HTAP_5.4: Other ground transport | |
| HTAP_6: Residential | HTAP_6: Residential |
| HTAP_7: Waste | HTAP_7: Waste |
| HTAP_8: Agriculture | HTAP_8.1: Agricultural waste burning |
| HTAP_8.2: Agriculture_livestock | |
| HTAP_8.3: Agriculture_crops |
Time series (2000-2018) of monthly and annual emissions by sector and country as .xls files.
Notes: Monthly (or Annual) emissions by country and sector are expressed in Mg/month (or Mg/year).
To facilitate data access and use, gridmaps at 0.5x0.5 degree resolution are also made available following the abovementioned specifications of the higher spatial resolution data (0.1x0.1 degree).
NMVOC speciation profiles are developed for the HTAP_v3 mosaic in support of chemical mechanisms modelling. The HTAP_v3 speciation is developed for 25 GEIA NMVOC species and it is based on the work developed by Huang et al. (2017), as described in v4.3.2_VOC_spec NMVOC speciated 1970-2012. All details are included in the .xls file.
Crippa, M., Guizzardi, D., Butler, T., Keating, T., Wu, R., Kaminski, J., Kuenen, J., Kurokawa, J., Chatani, S., Morikawa, T., Pouliot, G., Racine, J., Moran, M. D., Klimont, Z., Manseau, P. M., Mashayekhi, R., Henderson, B. H., Smith, S. J., Suchyta, H., Muntean, M., Solazzo, E., Banja, M., Schaaf, E., Pagani, F., Woo, J.-H., Kim, J., Monforti-Ferrario, F., Pisoni, E., Zhang, J., Niemi, D., Sassi, M., Ansari, T., and Foley, K.: The HTAP_v3 emission mosaic: merging regional and global monthly emissions (2000–2018) to support air quality modelling and policies, Earth Syst. Sci. Data, 15, 2667–2694, doi:10.5194/essd-15-2667-2023, 2023.
Huang, G., Brook, R., Crippa, M., Janssens-Maenhout, G., Schieberle, C., Dore, C., Guizzardi, D., Muntean, M., Schaaf, E., and Friedrich, R.: Speciation of anthropogenic emissions of non-methane volatile organic compounds: a global gridded data set for 1970–2012, Atmos. Chem. Phys., 17, 7683–7701, doi:10.5194/acp-17-7683-2017, 2017
For more information or data: JRC-EDGAR@ec.europa.eu